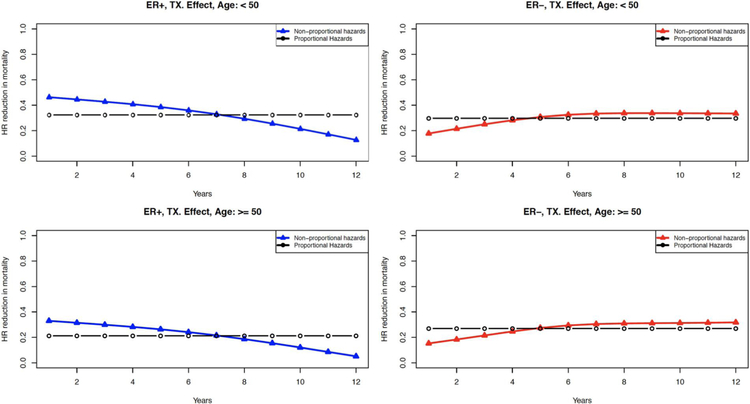
Figure 2.
Annual contribution of treatment to reducing the hazard of death from breast cancer for cases detected between 1990 and 2010 by estrogen receptor (ER) status and age (<50, >50). The black curves are the estimates assuming proportional hazards, and the colored curves are the hazard estimates using our nonproportional hazard assumption (blue for ER-positive cases and red for ER-negative cases). HR, hazard ratio; TX, treatment.

