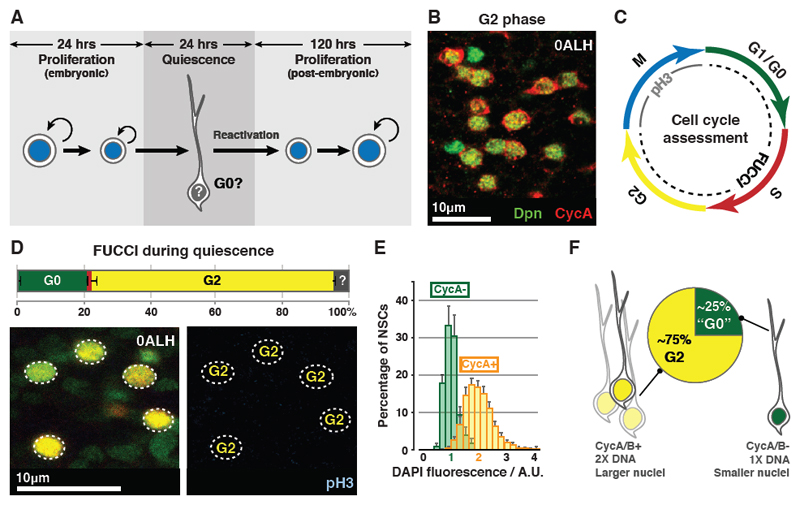
Fig. 1. qNSCs arrest in G0 or G2.
(A) qNSCs are smaller than proliferating NSCs and extend a primary process, which is retracted upon activation from quiescence. Proliferating NSCs in the embryo do not exhibit a primary process prior to entering quiescence.
(B) 73±0.79% of qNSCs (green) are CycA+ (red). n=10 tVNCs, ~150 NSCs each.
(C) Cell cycle phase assessment using FUCCI and pH3.
(D) Percentages of NSCs (outlined) in each cell cycle phase during quiescence. Colours as in (C). n=5 tVNCs, ~150 NSCs each. ?: undetermined.
(E) DAPI intensities of CycA+ and CycA- qNSC nuclei are significantly different (p=2.20x10⁻¹⁶, Kolgomorov-Smirnov test). n=10 tVNCs, ~75 NSCs each. A.U.: arbitrary units. 1 A.U.: mean DAPI intensity of the CycA- population. Error bars indicate S.E.M.
(F) Features of G2 and G0 qNSCs.
Images are single section confocal images, unless indicated otherwise, and anterior is up in this and all subsequent figures.

