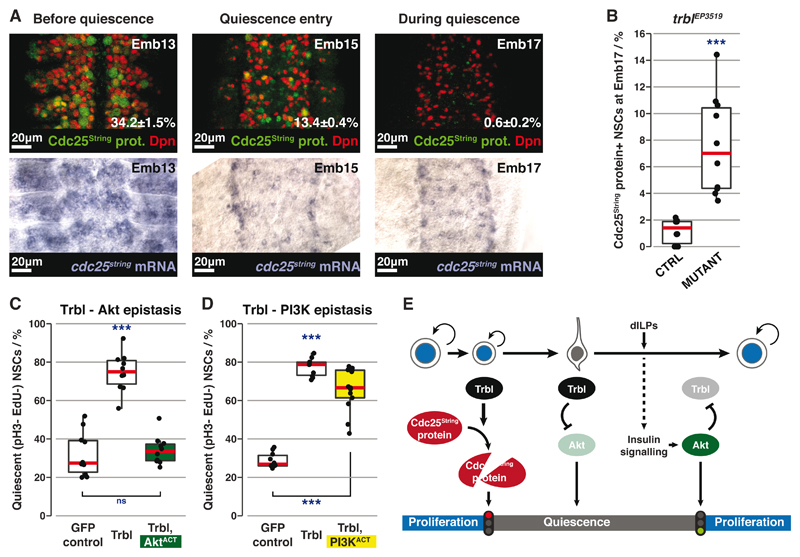
Fig. 4. Trbl induces and maintains quiescence through different mechanisms.
(A) Top row: Cdc25String protein (green) expression in NSCs (red) before and during quiescence (percentages are mean±SEM). n=10 tVNCs/time point, ~130 NSCs each. Maximum intensity projections. Bottom row: In situ hybridisation against cdc25string mRNA at the same stages.
(B) Percentages of Cdc25String protein+ NSCs in control (trblEP3519 heterozygote) vs mutant tVNCs. n=10 tVNCs/genotype, ~110 NSCs each. ***: p=9.08x10⁻⁵, Kolgomorov-Smirnov test.
(C and D) Quantification of qNSCs in epistasis experiments between GFP-Trbl and AktACT (C) or PI3KACT (D). n>10 tVNCs/condition, ~80 NSCs each. ***: p<3.39x10⁻⁹. ns: p>0.05, one way ANOVA followed by post-hoc Tukey’s HSD test. In (D), there is no significant difference between GFP-Trbl alone and GFP-Trbl+PI3KACT.
(E) Three-step model for Trbl activity.
Red lines indicate medians.

