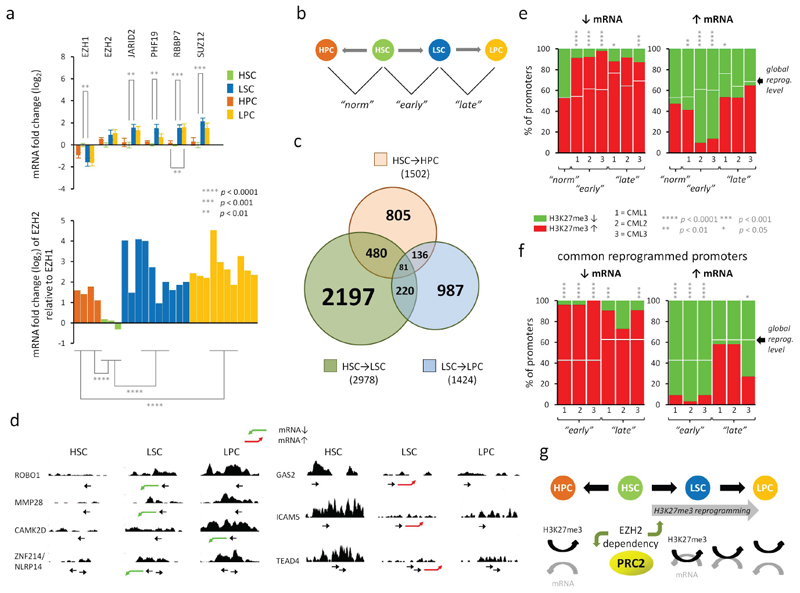
Figure 1. Mis-regulation of PRC2 leads to H3K27me3 reprogramming and increased coupling of H3K27me3 and mRNA expression in CML LSCs.
a. Top; the mean fold changes in mRNA expression for 6 PRC2 components and BCR-ABL1 in normal (HSCs and HPCs) and in CML (LSCs and LPCs) cells as determined by Fluidigm analysis performed in triplicate. Fold changes (log2) are expressed relative to levels found in HSCs. Error bars are standard error measurements (SEMs). Bottom; the mean levels of EZH2 mRNA relative to EZH1 mRNA in each of the bioreplicate samples as above. Significant p values (*; Student’s t-test) between equivalent cell type comparisons (HSC vs LSC, HPC vs LPC) are shown. Bioreplicates are n = 4 (HPC), n = 3 (HSC), n = 10 (LSC), n = 10 (LPC). b. Schematic diagram depicts how changes in H3K27me3 levels between normal and CML cells were determined with respect to three pairwise cell type comparisons: HSCs vs HPCs (“norm”), HSCs vs LSCs (“early”), LSCs vs LPCs (“late”). c. Venn diagram depicts the relationship between the numbers of promoters which show altered levels of H3K27me3 in three pairwise comparisons (HSC→HPC; HSC→LSC; LSC→LPC). d. Examples of H3K27me3 read densities across genes that are up- (red arrow) or down-(green arrow) regulated (mRNA) in CML cells compared to HSCs. Location of transcription start site and direction of transcription are shown by →. Profiles were visualised in the UCSC genome browser (hg18; NCBI build 36.1). e. Bar diagrams show the percentages (%) of all reprogrammed promoters having significant gains (red) or losses (green) of H3K27me3 (p < 0.05; one sample t-tests) when their cognate mRNA levels are down- (↓) or up- (↑) regulated (Affymetrix analysis) in each of three pairwise comparisons for n = 3 bioreplicate CML(1,2,3) and normal samples. f. Bar diagrams show the percentages (%) of all promoters reprogrammed in all three CML samples (common) having significant gains (red) or losses (green) of H3K27me3 (p < 0.05; one sample t-tests) when their cognate mRNA levels are down- (↓) or up- (↑) regulated (Affymetrix analysis) as above. In e and f, expected percentages of H3K27me3 gains associated with global reprogramming of H3K27me3 levels, irrespective of mRNA expression changes, are shown (white bars). Significant p values (*) are shown based on observed vs expected levels of H3K27me3 gains or losses at promoters (Yates Chi-squared or Fischer Exact tests). g. Schematic representation of H3K27me3 reprogramming in CML leading to increased mechanistic coupling of H3K27me3 levels and mRNA expression - consistent with an altered dependency for EZH2 in CML (upward green arrow). HSCs require EZH1(14) but not EZH2(15) (downward green arrow).

