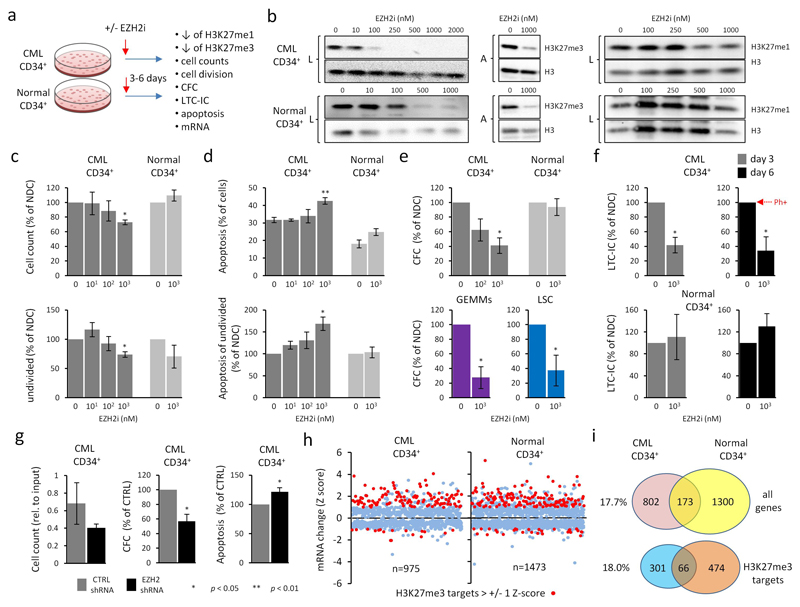
Figure 2. CML cells are sensitive to chemical and genetic inhibition of EZH2.
a. Schematic for EZH2i treatment in primary CML and normal CD34+ cells. n = 3 bioreplicates in all instances described below. b. Representative western analysis of H3K27me3 and H3K27me1 levels in CML and normal CD34+ cells treated for 6 days with increasing concentrations of EZH2i as indicated. L = laemmli buffer; total cellular protein. A = acid extraction; enriched for histones. Levels of bulk histone H3 were used as loading controls. c. Viability of CML and normal CD34+ cells treated with EZH2i for 6 days. Mean total viable cell counts (top); mean viable undivided (CTVmax) CD34+ cells (bottom). d. Levels of apoptosis (Annexin V-positive cells) in CML and normal CD34+ cells treated with EZH2i. Mean total apoptosis (top) and mean apoptosis in undivided (CTVmax) CD34+ cells (bottom). e. Colonogenic (CFC) potential of CML and normal CD34+ cells treated with EZH2i. Mean total CFC outputs (top) and GEMM outputs (bottom) from CD34+ cells; total CFC outputs from LSCs (CD34+CD38-) (bottom). f. Colonogenic potential of CML and normal CD34+ cells from LTC-IC after 3 days or 6 days treatment with EZH2i. % of cells Ph+ (i.e., BCR-ABL+) in NDC (day 6) is shown by the arrowhead (red). g. Effect of EZH2 shRNA knockdown in CML34+ cells. Cell counts (left), CFC output (middle) and apoptosis (Annexin V-positive cells) (right) for CML CD34+ cells transduced with EZH2 or control shRNA for 3 days. Two different EZH2 shRNAs were used to derive data. h. Scatterplot depicting global mRNA expression changes (Z-scores) for 975 and 1473 genes in CML and normal CD34+ cells respectively as a consequence of EZH2i treatment (and where both mRNA and H3K27me3 status is known) (E-MTAB-2893; E-MTAB-3552). H3K27me3 targets (> +/- 1 SD from the mean) are highlighted (red). Significant p values (*; one sample t-tests in c → g) are shown in the key below panel g. EZH2i is GSK343 for data shown in b → f and in h. i. Venn diagrams depict the degree of overlap between genes showing mRNA changes due to EZH2i treatment in CML and normal CD34+ cells; all genes (top), H3K27me3 target genes (bottom). % of overlap with respect to totals for CML CD34+ cells (left).

