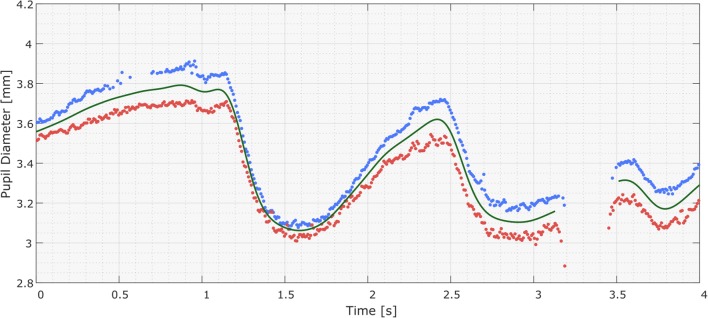
Fig. 4.
Results of the preprocessing pipeline, showing the raw pupil diameter samples for the right and left eyes (blue and red dots, respectively) and the interpolated and low-pass-filtered “mean pupil diameter” signal (green curves). The interpolated and filtered signals of the left and right pupils are not shown. The mean pupil diameter signal was generated from the valid raw samples of both pupils, including during the absence of one pupil’s data, in which case the local pupil size difference was estimated and used to generate the “mean pupil size” value (as can be seen at 0.6 s). The settings used stipulated that the signals were not to be interpolated over gaps larger than 250 ms—hence, the missing data around 3.3 s.

