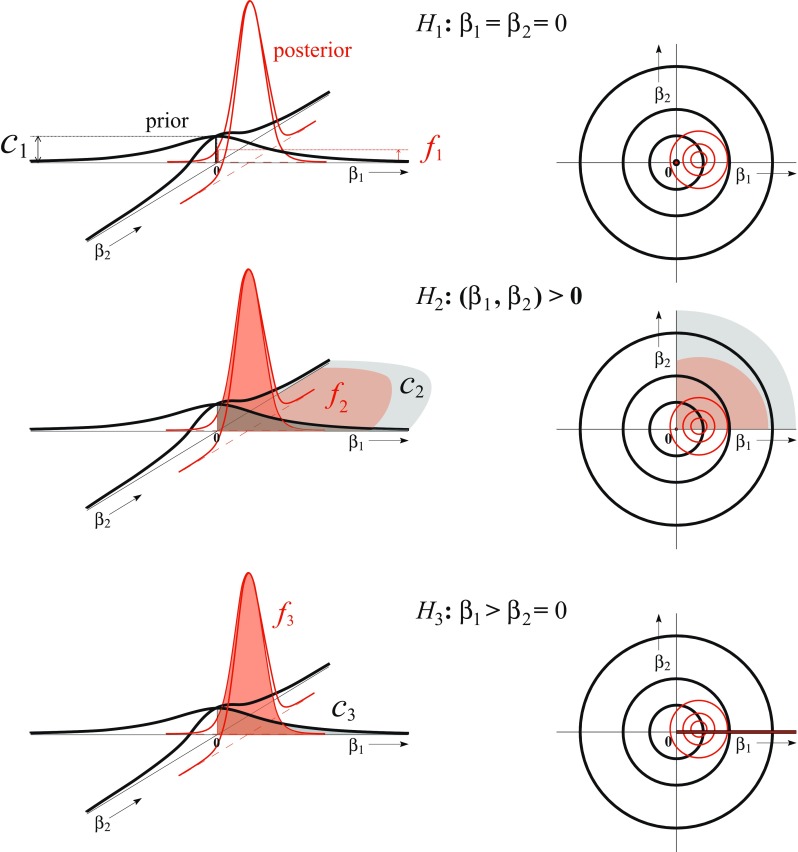
Fig. 1.

Graphical representation of the default Bayes factor for H1 : β1 = β2 = 0 (upper panels), H2 : β > 0 (middle panels), and H3 : β1 > β2 = 0 (lower panels) as the ratios of the posterior (red thin lines) and prior (black thick lines) density at the null value, the posterior and prior probabilities, and the surfaces of the cross sections of the posterior and prior density, respectively
