Fig. 1.
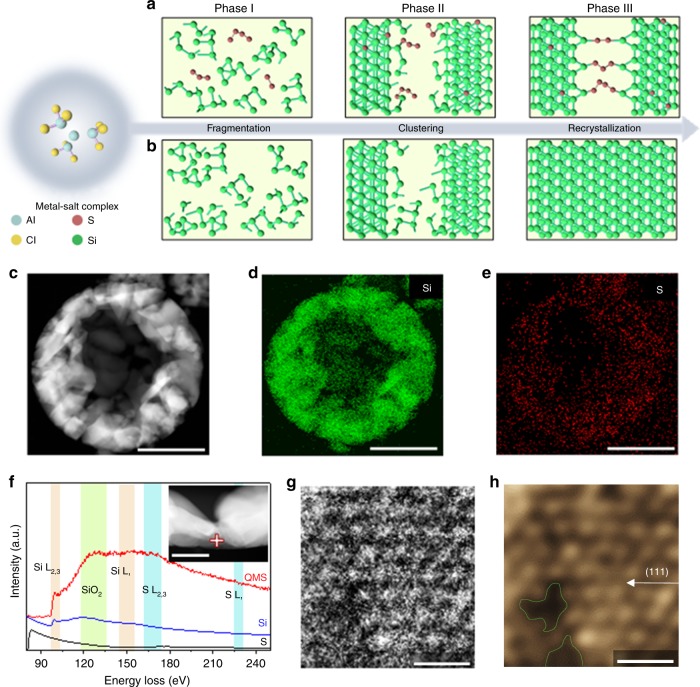
Structural evolution and characterization of quasi-metallic silicon. a, b Schematic of each stage for (a) QMS and (b) bare Si. c Scanning transmission electron microscopy (STEM) image. d, e Corresponding energy-dispersive X-ray spectroscopy (EDS) maps for (d) Si and (e) sulfur. f EELS spectra for elemental sulfur, bare Si, and QMS (inset: STEM image of the EELS measurement position). g, h High-magnification STEM images of QMS. Scale bars, 1 μm (c–e); 50 nm (f); 5 Å (g, h)

