Figure 3.
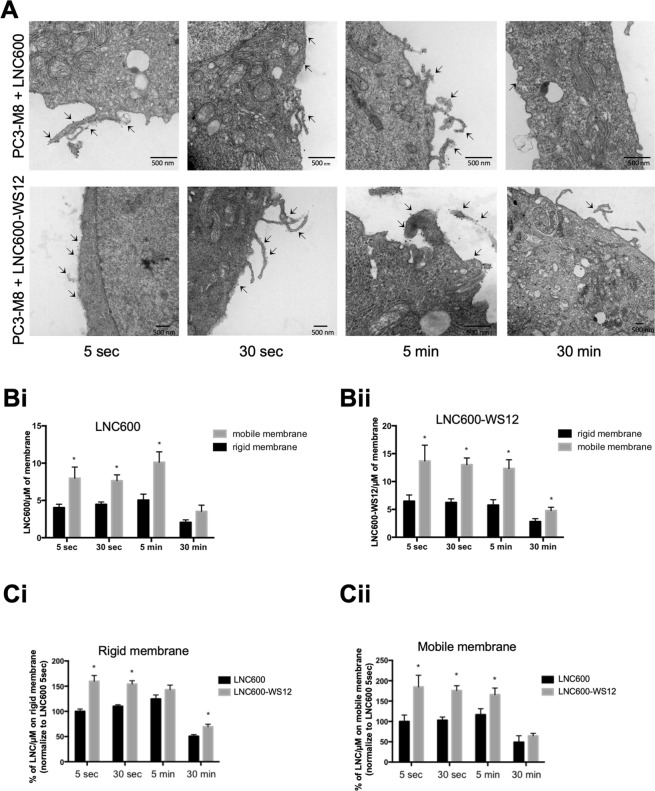
Plasma membrane penetration and dynamic localization of lipid nanocapsules. (A) Electron micrographs of PC3-M8 cells treated with 100 nM of empty LNC600 (upper panels) or 100 nM of LNC600-WS12 (lower panels) for different times (5 s, 30 s, 5 min and 30 min). Lipid Nanoparticles appeared as electron-dense spots located at the plasma membrane and are indicated by an arrow. (B) Bar graphs show the quantification of the data for empty LNC600 (Bi) or LNC600-WS12 (Bii) as µm of mobile or rigid plasma membrane at different timepoints after treatment with 100 nM of empty LNC600 or LNC600-WS12. (C) Bar plot showing the quantification of empty LNC600 or LNC600-WS12 in the rigid (Ci) and mobile (Cii) fractions of plasma membranes obtained from PC3-M8 cells at different timepoints after treatment with 100 nM of empty LNC600 or LNC600-WS12. *P < 0.05 (ANOVA, Tukey’s multiple comparisons test).

