Figure 5.
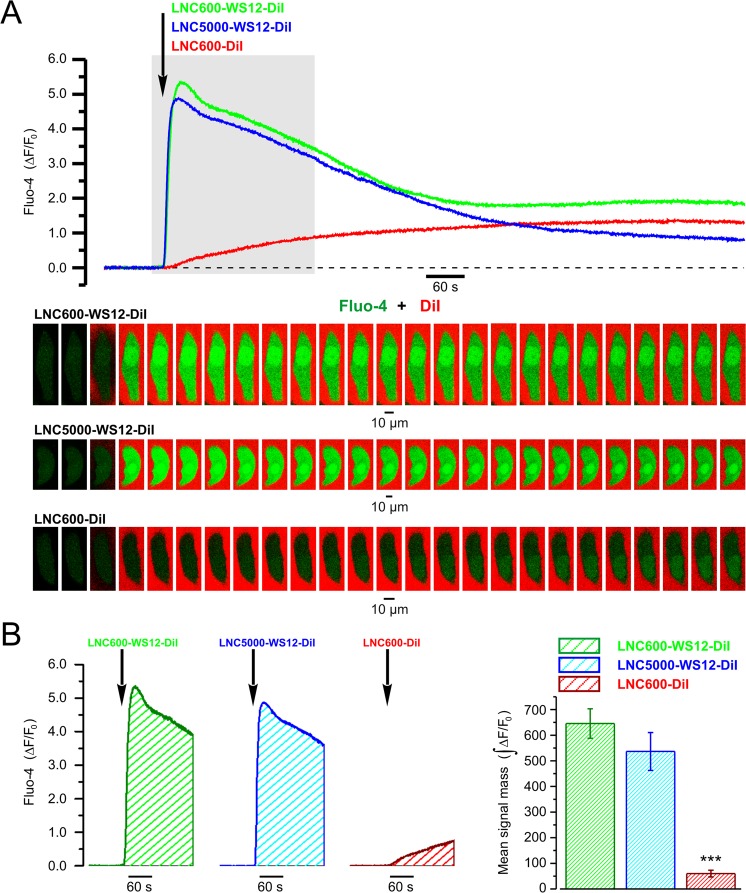
LNC600 and LNC5000 are both capable of delivering WS12 to the agonist binding site on TRPM8. (A) Plot (top) relates the dynamics of relative changes (ΔF/F0) in fluo-4 fluorescence induced by local application of DiI/WS12-containing LNC600 with PEG tails of 600 MW or 5000 MW (LNC600-WS12-DiI and LNC5000-WS12-DiI, respectively) and LNC600 containing DiI only (LNC600-DiI). The moment of LNC application of 300 times diluted LNC suspension is depicted by arrow. The traces and labels are shown in corresponding color. The gallery (bottom) shows every 50th image of Fluo-4 (green) and DiI (red) fluorescence captured during the highlighted (top) period. The x-y time series confocal (optical slice < 0.8 µm) imaging (at 5 Hz) reported changes in [Ca2+]i (Fluo-4) and presence of LNC600 in the vicinity of the cell (DiI). Note that unlike LNC600-WS12-DiI or LNC5000-WS12-DiI, LNC600-DiI failed to induce [Ca2+]i transient, thus confirming TRPM8-specificity of the response. (B) The bar diagram plot (right) compares masses of Fluo-4 signal (left: examples; ) during first 180 s of application of LNC600-WS12-DiI (n = 6), LNC5000-WS12-DiI (n = 6) and LNC600-DiI (n = 8). ***P < 0.001, two-tailed Student’s t-test.

