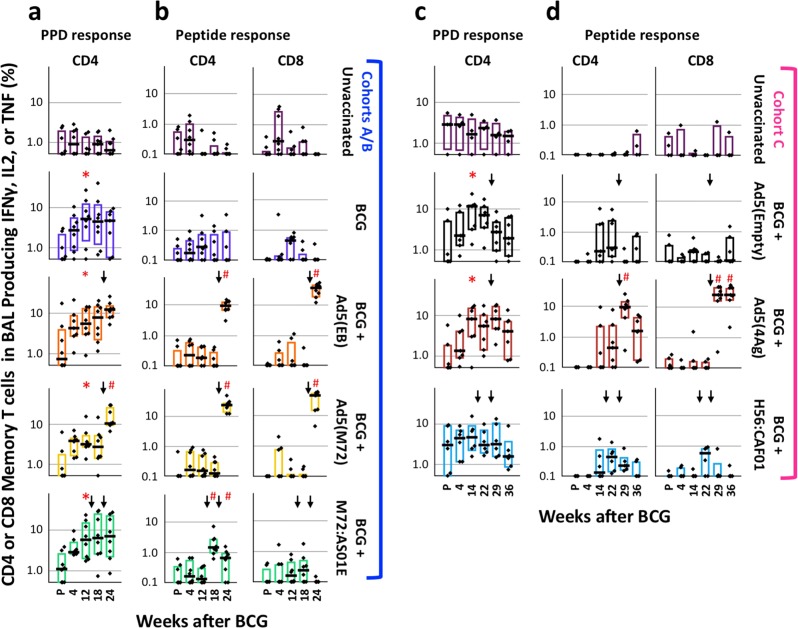
Fig. 2.
Cellular immune responses in BAL after vaccination. The frequency of memory CD4 or CD8 T cells in the BAL producing any combination of IFNγ, IL2, or TNF in response to PPD (a, c, CD4 only) or to peptides corresponding to specific antigens delivered in the boost (b, d) at the indicated weeks before and after BCG immunization. Cytokines were gated as in Fig. S2 and cytokine frequencies are shown on a log10 scale. Black arrows indicate the time(s) of boosting. Dots represent individual animals, bars show the interquartile range with the median response indicated. *p ≤ 0.05 compared with pre-vaccination (P) within the same group; #p ≤ 0.05 compared with the most recent time point prior to boosting within the same vaccine group using two-tailed Student t test

