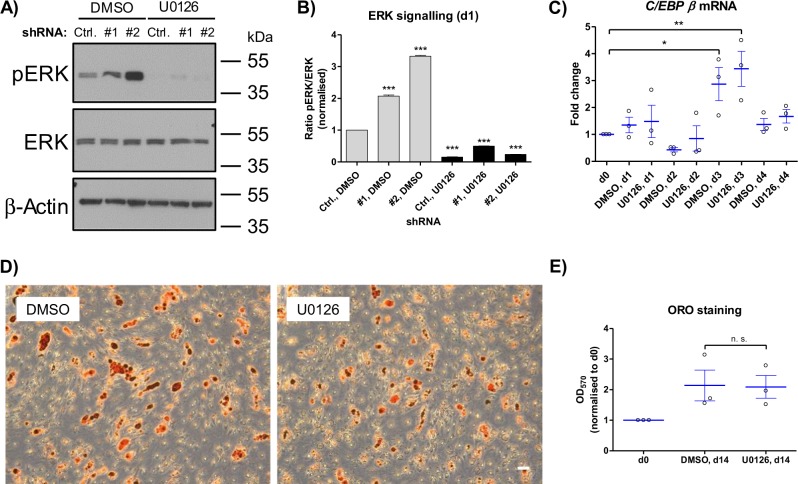
Fig. 5. Effects of the MEK inhibitor U0126 on adipogenesis in ASCs.
a Western blot analysis of ERK activation in differentiating Sprouty1 KD ASCs co-treated with DMSO (vehicle control) or U0126 (10 µM) for 1 day. β-actin served as input control. Molecular masses are given in kDa. Representative result of n = 3 independent experiments (i.e., donors). b Densitometry corresponding to a). Values are expressed as mean ± SEM, n = 3. Statistical comparison was done using one-way ANOVA and Dunnett´s Multiple Comparison test. c RT-qPCR analysis of wildtype ASCs treated with DMSO (vehicle-control) or U0126 (10 µM) during adipogenesis. Values are presented as mean ± SEM of n = 3 different donors. Statistical comparison was done using one-way ANOVA and Dunnett´s Multiple Comparison test. d Oil Red O staining of DMSO or U0126 (10 µM) treated ASCs on d14 of adipogenic differentiation. Representative result of n = 3 different donors. Magnification ×5. Scale bar 100 µm. e Photometric quantification of Oil Red O staining on d14 of adipogenesis. Corresponding to the results shown in D). Values are presented as mean ± SEM of n = 3 different donors. Statistical comparison was performed using the two-tailed unpaired t-test. n. s.: not significant

