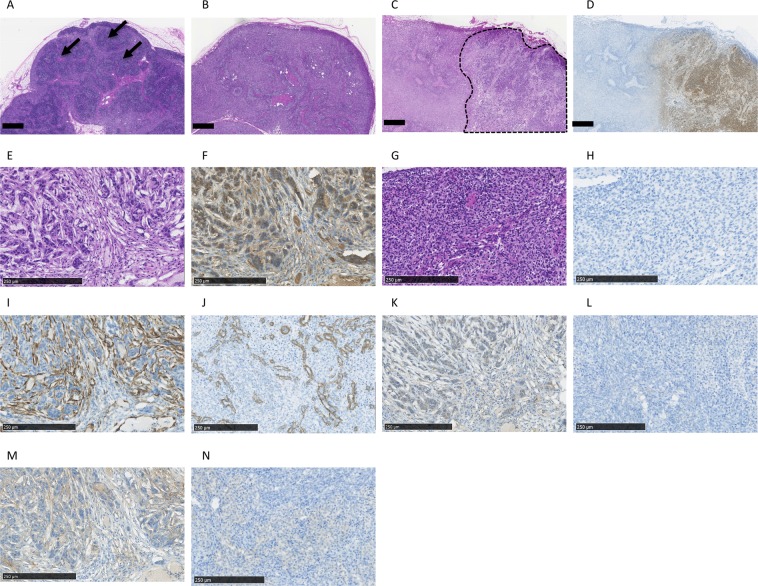
Figure 5.
Histological analysis of lymph nodes. HE-stained lymph nodes of wild-type (A) and lymphoid follicles is indicated by the arrows. HE-stained lymph nodes of RAG2-knockout swine (B). HE-stained metastatic lymph nodes of RAG2-knockout swine (C). Metastatic tumour cells are surrounded by a dotted line. Immunohistochemical analysis of GFP expression in RAG2-knockout swine with tumours (D). HE-stained lymph nodes of RAG2-knockout swine with metastatic tumour (E) and IHC analysis using an anti-GFP antibody (F). HE-stained lymph nodes of RAG2-knockout swine (G) and IHC analysis using an anti-GFP antibody (H). Immunohistochemical analysis of alpha SMA expression in lymph nodes of RAG2-knockout swine with (I) and without (J) a metastatic tumour. Immunohistochemical analysis of TGF-beta expression in lymph nodes of RAG2-knockout swine with (K) or without (L) a metastatic tumour. Immunohistochemical analysis of tenascin C expression in lymph nodes of RAG2-knockout swine with (M) and without (N) a metastatic tumour. The scale bar = 1 mm (A–D) and 250 µm (E–N).

