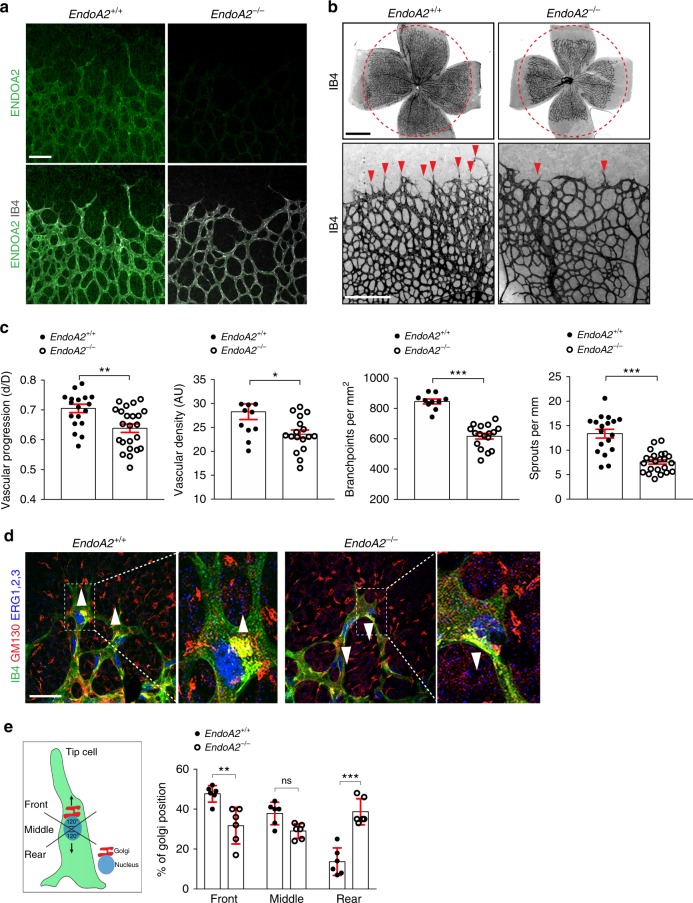
Fig. 1.
ENDOA2 regulates postnatal mouse retina angiogenesis. a ENDOA2 and IB4 staining in retinal flatmounts from P5 mice. Note enrichment of ENDOA2 in IB4 + wild-type vessels, and absence of ENDOA2 expression in EndoA2−/− mice. b IB4 stained P5 retinal flatmounts of EndoA2+/+ and EndoA2−/− mice. The dashed circles outline vascular coverage in wild-type retina. Red arrowheads show tip cell sprouting. c Quantification of vascular progression (d: vascular coverage length; D: retinal petal length), vessel density, number of branchpoints and vessel sprouts (N = 10–23 retinas/group, t-test: *P < 0.05, **P < 0.01, ***P < 0.001). d IB4, GM130, and ERG1/2/3 labeling shows Golgi orientation (white arrowheads) of P5 tip cells in EndoA2+/+ and EndoA2−/− retinas. Boxed areas are magnified in the right panels. e Schematic of Golgi positions in tip cells and quantification of the Golgi position in retinas shown in d (N = 6 retinas per group, at least 50 tip cells per retina were quantified; two-way ANOVA: ns P > 0.05, **P < 0.01, ***P < 0.001). Error bars represent mean ± s.e.m. Scale bars: a 100 μm, b (upper panel) 1 mm, b (lower panel) 300 μm, d 50 μm

