Fig. 2.
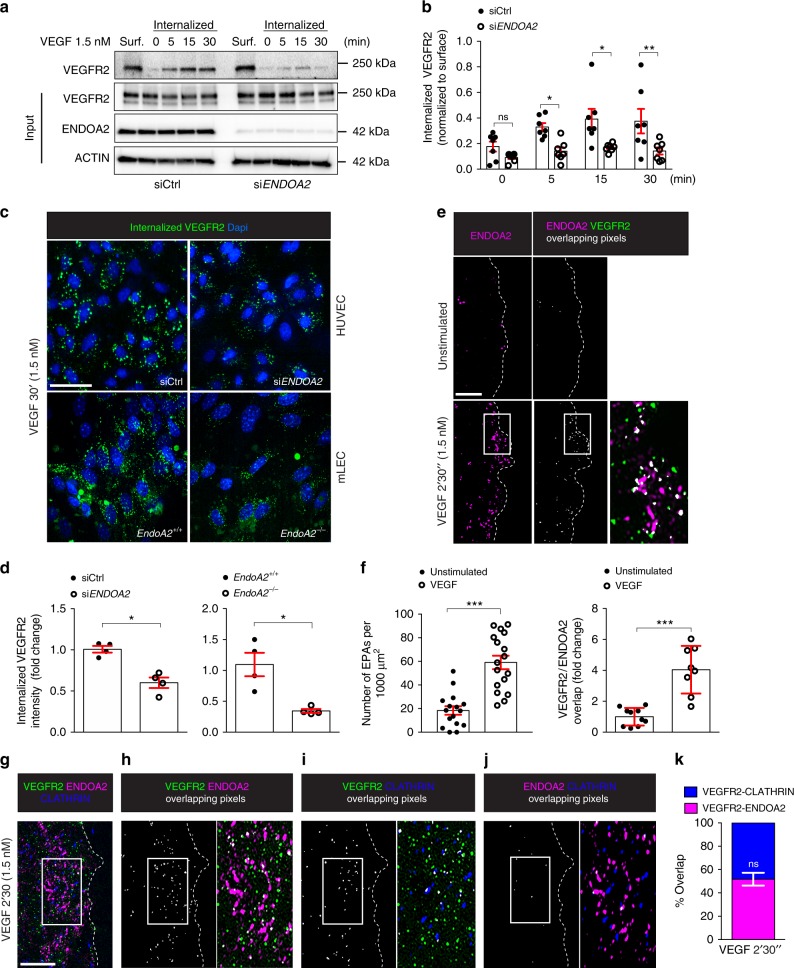
ENDOA2 mediates CLATHRIN-independent VEGFR2 internalization. a Cell surface biotinylation assay of VEGFR2 internalization in response to VEGF in Control siRNA (siCtrl) and ENDOA2 siRNA silenced HUVECs. VEGFR2, ENDOA2, and ACTIN expression in the total cell lysate are shown (input). Surf: surface expression of VEGFR2 before ligand stimulation and stripping. b Quantification of internalized VEGFR2 normalized to VEGFR2 surface expression (N = 7 independent experiments; two-way ANOVA: ns P > 0.05, *P < 0.05, **P < 00.1). c Antibody feeding assay of VEGFR2 internalization in response to VEGF (1.5 nM, 30 min) in Ctrl and ENDOA2 siRNA silenced HUVECs or mLECs isolated from EndoA2+/+ and EndoA2−/− mice. d Quantification of internalized VEGFR2 fluorescence in c (N = 4 independent experiments, at least 103 cells analyzed per experiment; Mann–Whitney U test: *P < 0.05). e SIM images of HUVEC lamellipodia stained for ENDOA2 and VEGFR2 before and after VEGF stimulation (1.5 nM for 2′30″). f Left panel shows quantification of EPA number at the lamellipodia (N = 16–17 cells/group analyzed from three independent experiments; t-test and Mann–Whitney U test: ***P < 0.001). Right panel shows quantification of pixel overlap between VEGFR2 and ENDOA2 fluorescent signals (N = 8–10 cells/group analyzed from three independent experiments; Mann–Whitney U test: ***P < 0.001). g SIM image of HUVEC lamellipodia stained for ENDOA2, VEGFR2 and CLATHRIN heavy chain after VEGF stimulation (1.5 nM for 2′30″). h Overlapping pixels between VEGFR2/ENDOA2, i overlapping pixels between VEGFR2/CLATHRIN, and j overlapping pixels between ENDOA2/CLATHRIN from the image presented in g are shown in white. Boxed areas are magnified to highlight VEGFR2/ENDOA2, VEGFR2/CLATHRIN, or ENDOA2/CLATHRIN overlaps (white). k Quantification of overlap between VEGFR2/ENDOA2 and VEGFR2 /CLATHRIN fluorescent signals (N = 8–10 cells per group analyzed from three independent experiments; Mann–Whitney U test: ns P > 0.05). Error bars represent mean ± s.e.m. Scale bars: c 20 μm, e 2 μm, g 1 μm

