Fig. 4.
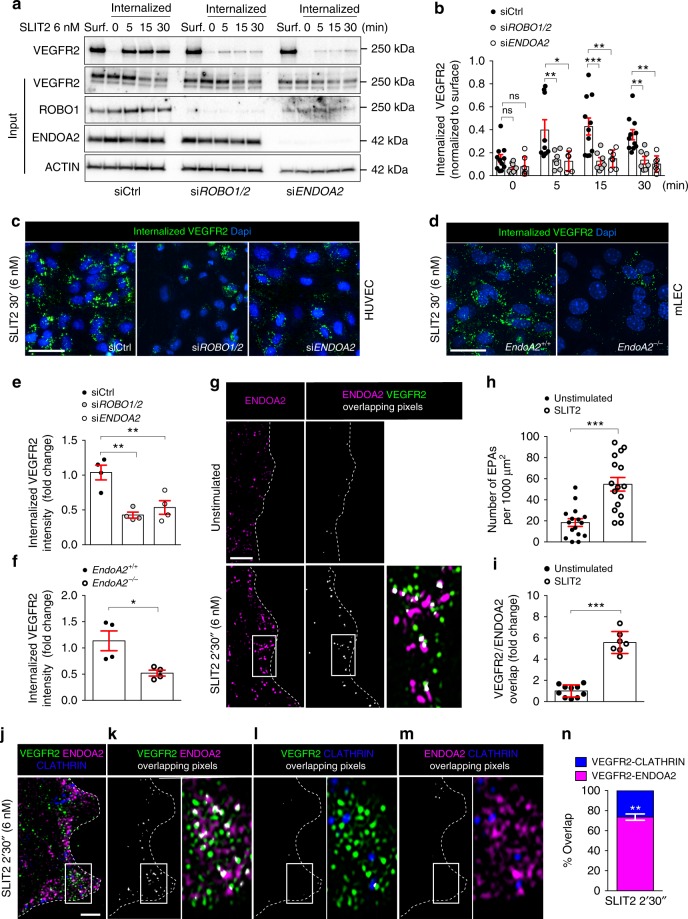
SLIT2 induces ENDOA2-dependent VEGFR2 internalization. a Cell surface biotinylation assay of VEGFR2 internalization in response to SLIT2 (6 nM) in Control (Ctrl), ROBO1/2 and ENDOA2 siRNA silenced HUVECs. VEGFR2, ROBO1, ENDOA2, and ACTIN expression from the total cell lysate are shown as loading controls (input). Surf: surface expression. b Quantification of internalized VEGFR2 normalized to VEGFR2 surface expression before stimulation (N = 7 independent experiments; two-way ANOVA test: *P < 0.05, **P < 0.01, ***P < 0.001, ns P > 0.05). c, d Antibody feeding assay to measure VEGFR2 internalization in response to SLIT2 (6 nM) in Ctrl, ROBO1/2, and ENDOA2 siRNA silenced HUVECs (c) and mLECs from EndoA2+/+ and EndoA2−/− mice (d). e, f Quantification of internalized VEGFR2 fluorescent intensity shown in c and d, respectively (N = 4 independent experiment, at least 103 cells analyzed per experiment; e one-way ANOVA and f Mann–Whitney U test: *P < 0.05). g SIM images of HUVEC lamellipodia stained for ENDOA2 before and after SLIT2 stimulation (6 nM for 2′30″). h SLIT2 effects on EPA formation at the cell migration front (N = 16–17 cells per group analyzed from three independent experiments; t-test: ***P < 0.001). i SLIT2 increases the pixel overlap between VEGFR2 and ENDOA2 fluorescent signals (N = 8–10 cells per group analyzed from three independent experiments; Mann–Whitney U test: ***P < 0.001). j SIM images of HUVEC lamellipodia stained for ENDOA2, VEGFR2, and CLATHRIN heavy chain after SLIT2 stimulation (6 nM for 2′30″). k–m Overlapping pixels between VEGFR2/ENDOA2 (k), VEGFR2/CLATHRIN (l), and ENDOA2/CLATHRIN (m) from the image presented in j are shown in white. Boxed areas are magnified to highlight VEGFR2/ENDOA2, VEGFR2/CLATHRIN, or ENDOA2/CLATHRIN overlap (white). n Quantification of overlap between VEGFR2/ENDOA2 and VEGFR2/CLATHRIN fluorescent signals (N = 8–10 cells per group analyzed from three independent experiments; Mann–Whitney U test: **P < 0.01) (right panel). Error bars represent mean ± s.e.m. Scale bars: c and d 20μm, g 2μm, j 1μm

