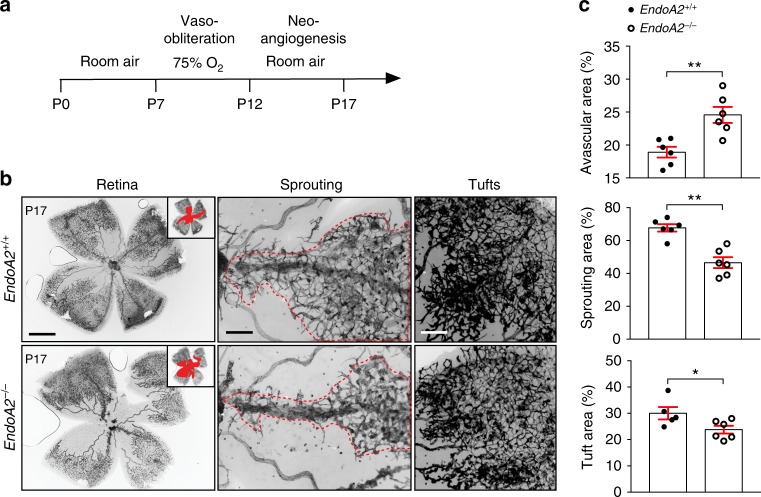
Fig. 7.
ENDOA2 promotes pathological angiogenesis. a Schematic of the experimental strategy to assess neoangiogenesis after oxygen-induced retinopathy (OIR). b Left panels show retinal flatmounts after OIR. Insets show avascular area measured for quantification. Middle panels show higher magnification of vessels sprouting from veins. Right panels show higher magnification of neovascular tufts. c Avascular area, sprouting and neovascular tuft quantifications of retinas shown in b (N = 6 retinas per group; Mann–Whitney U test: *P < 0.05, **P < 0.01). Error bars represent mean ± s.e.m. Scale bars: b left panel 1 mm, b middle and right panels 100 μm

