Fig. 1.
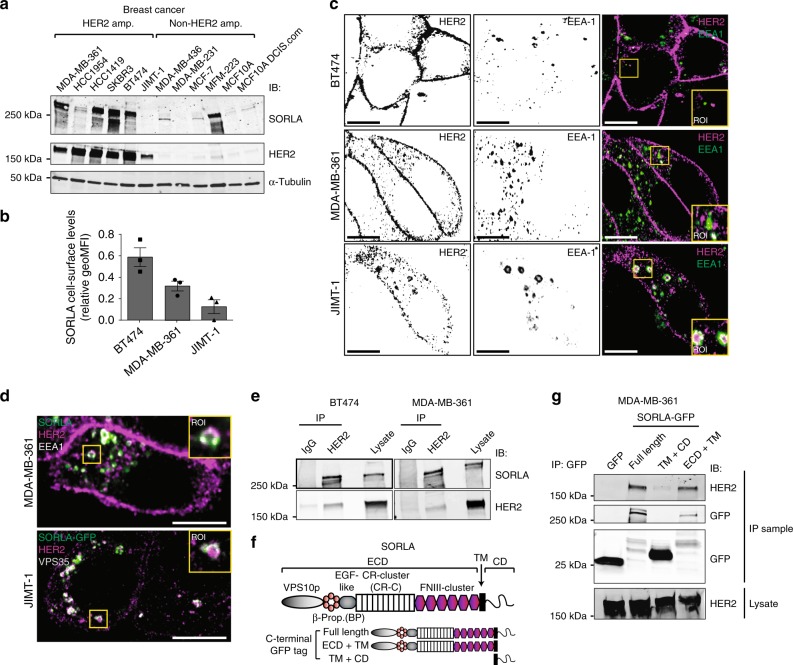
SORLA is highly expressed in HER2-amplified breast cancer cells and co-traffics with HER2. a Western blot analysis of SORLA and HER2 protein levels in breast cancer cell lines. α-tubulin is a loading control. b Quantification of SORLA cell-surface levels by FACS in MDA-MB-361, BT474 and JIMT-1 cells (n = 3 independent experiments; data are geo mean fluorescence intensity (MFI) ± standard error of mean (s.e.m.). c Confocal microscopy imaging of HER2 (magenta) and EEA-1 (green) in BT474, MDA-MB-361 and JIMT-1 cells. Co-localisation of the HER2 and EEA1 signals is indicated in white in the merged panels. d Endogenous SORLA (green), HER2 (magenta) and EEA-1 (white) staining in MDA-MB-361 cells (top panel). Endogenous HER2 (magenta) and VPS35 (white) staining in JIMT-1 cells expressing SORLA-GFP (green) (bottom panel). e Co-immunoprecipitation of endogenous SORLA with endogenous HER2 in MDA-MB-361 and BT474 cells. f Schematic of the SORLA protein domains and summary of the constructs used. g Co-immunoprecipitation of endogenous HER2 with different SORLA-GFP fragments in MDA-MB-361 cells. Scale bars: 10 µm. Where immunoblots and micrographs are shown, these are representative of n = 3 independent experiments; IB immunoblotting, IP immunoprecipitation. ECD extracellular domain, TM transmembrane domain, CD cytosolic domain

