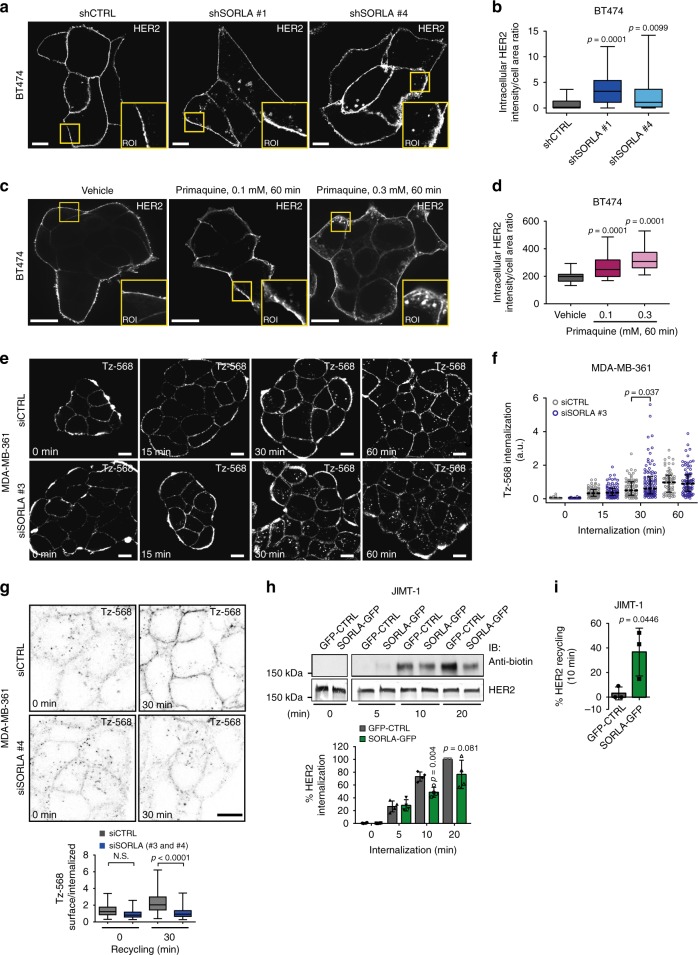
Fig. 3.
SORLA promotes HER2 recycling. a, b Confocal microscopy images (a) and quantification (b) of HER2 staining after SORLA silencing (shSORLA #1 and shSORLA #4) in BT474 cells (n = 31 shCTRL, 25 shSORLA #1 and 20 shSORLA #4 cells from two experiments; analysis performed on 8-bit images; statistical analysis: Mann−Whitney test). c, d Confocal microscopy images (c) and quantification (d) of HER2 in vehicle- and primaquine-treated (60 min) BT474 cells (n = 34 (vehicle), 28 (0.1 mM primaquine) and 34 (0.3 mM primaquine) cells; analysis performed on 16-bit images; statistical analysis: Mann−Whitney test). e, f Microscopy analysis (e) and quantification (f) of AlexaFluor 568-labelled trastuzumab (Tz-568) internalization in MDA-MB-361 cells silenced with SORLA (siSORLA #3) or scramble (siCTRL) siRNA at the indicated time points (mean ± s.e.m; n = 64, 77, 86 and 64 siCTRL cells and 111, 83, 103 and 87 siSORLA #3 cells at the 0, 15, 30 and 60 min time points, respectively, from two independent experiments; statistical analysis: Mann−Whitney test; a.u. arbitrary units). g Microscopy-based HER2 recycling assay in control or SORLA siRNA-treated MDA-MB-361 cells. Labelled HER2 recycling back to the plasma membrane was monitored over 30 min after an internalization step (45 min) and imaged with a confocal microscope. Ratio of surface/internalized Tz-568 signal is displayed as box plots (n = 34 and 57 siCTRL cells and 45 and 47 siSORLA cells for 0 and 45 min time points, respectively, from two independent experiments; statistical analysis: Nonparametric Kruskal−Wallis). h Immunoblotting analysis of biotin-labelled cell-surface HER2 internalization in JIMT-1 cells overexpressing SORLA-GFP (or control GFP; GFP-CTRL), and quantification of internalized HER2 relative to total HER2 (data are mean ± s.d.; n = 4 independent experiments; statistical analysis: unpaired Student’s t test). i Quantification of HER2 recycling rate (% return of internalized biotinylated cell-surface HER2 back to the plasma membrane after 10 min) in JIMT-1 cells transfected with GFP-CTRL or SORLA-GFP following 30 min of endocytosis (data are mean ± s.d.; n = 3 independent experiments; statistical analysis: unpaired Student’s t test). Scale bars: 10 µm. Box plots represent median and IQR and whiskers extend to maximum and minimum values. Where micrographs are shown, these are representative of n = 3 independent experiments; ROI magnified region of interest

