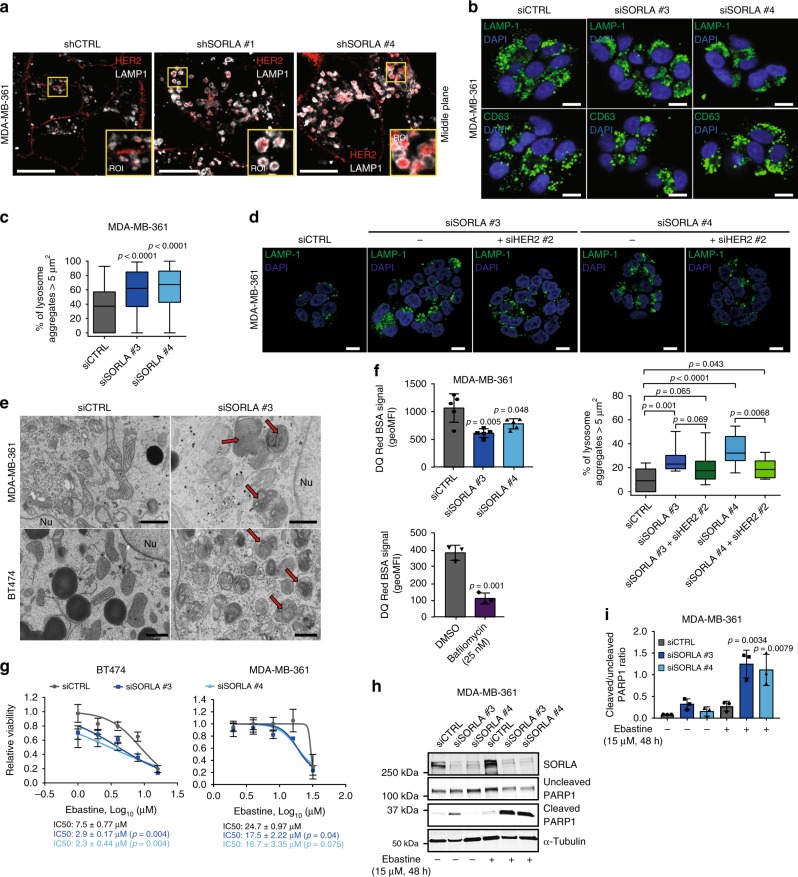
Fig. 4.
Silencing SORLA induces HER2 accumulation in dysfunctional lysosomes. a Immunofluorescence imaging of LAMP1 (white) and HER2 (red) in shCTRL and shSORLA MDA-MB-361 cells (n = 3 independent experiments). b Immunofluorescence imaging of LAMP1 (green) and CD63 (LAMP3; green) in MDA-MB-361 cells (blue is DAPI) after scramble (siCTRL) or SORLA (siSORLA #3 and siSORLA #4) siRNA silencing (n = 3 independent experiments). c Quantification of late endosomes/lysosome aggregation after SORLA silencing in MDA-MB-361 cells. LAMP1-positive structures ≥ 5 µm2 were considered as lysosome aggregates (n = 73 siCTRL, 79 siSORLA #3 and 67 siSORLA #4 cells from three independent experiments; statistical analysis: Mann−Whitney test). d Immunofluorescence imaging and quantification of lysosomal aggregation in MDA-MB-361 cells treated with the indicated siRNA (n fields of view analysed, total cells = 11, 131 (siCTRL); 12, 182 (siSORLA #3); 11, 169 (siSORLA #3 + siHER2 #2); 10, 133 (siSORLA #4); 10, 121 (siSORLA#4 + siHER2 #2) from two independent experiments; statistical analysis: Mann−Whitney test). e Transmission electron microscopy imaging of lysosomes in siCTRL or siSORLA MDA-MB-361 and BT474 cells. Red arrows indicate the maturation defect in late endosome/lysosome structures (n = 3 technical replicates). f Flow cytometry analysis of the fluorescence signal in DQ Red BSA-loaded (24 h) MDA-MB-361 cells after scramble (siCTRL) or SORLA (siSORLA #3 and siSORLA #4) silencing. Cells loaded with DQ Red BSA (4 h) and treated with bafilomycin (or vehicle) are included as controls (bafilomycin blocks lysosome function) (mean ± s.d.; n = 5 independent experiments; statistical analysis: unpaired Student’s t test). g Cell viability assay to determine ebastine (48 h treatment) IC50 values in SORLA- or control-silenced BT474 and MDA-MB-361 cells (mean ± s.d.; n = 12, four technical replicates, three independent experiments; statistical analysis: unpaired Student’s t test). h, i Immunoblotting (h) and quantification (i) of cleaved PARP1 in ebastine-treated (15 µM, 48 h) siCTRL and siSORLA #3 or siSORLA #4 MDA-MB-361 cells. α-tubulin is a loading control (mean ± s.d.; n = 3 independent experiments; statistical analysis: unpaired Student’s t test). Scale bars: 10 µm (a, b, d) and 1 µm (e). Box plots represent median and IQR and whiskers extend to maximum and minimum values. Nu nucleus

