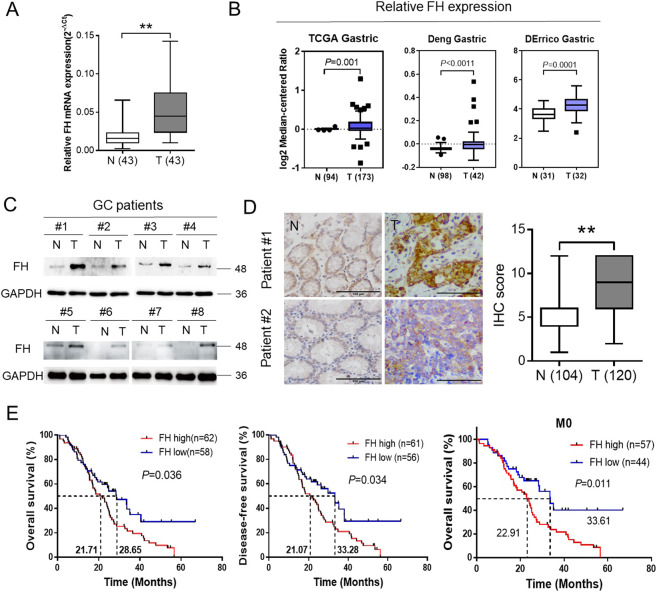
Fig. 6. FH expression was an independent prognostic factor in GC patients.
a–b FH was overexpressed in GC tissues, as determined by qPCR analysis of 43 pairs of patient samples from our hospital (SYSUCC) and a microarray data set available from Oncomine (https://www.oncomine.com/, **P < 0.01, Student’s t-test). c Immunoblotting of FH for eight pairs of GC and adjacent nontumor tissues. GAPDH was used as the internal reference. d IHC images (left) of tumor(T) and adjacent nontumor tissues (N) from two representative GC patients of. The scale bars represent 100 μm for 400× images. IHC score for 120 tumor tissues and 104 adjacent nontumor tissues from GC patients (right, **P < 0.01, Student’s t-test). e The OS (P = 0.0357) and DFS (P = 0.0339) curves for patients with low and high levels of FH expression were generated using the Kaplan-Meier method. Compared with patients with metastasis, patients without metastasis in the indicated groups showed a significant difference in OS time (P = 0.0108). P values were calculated using the log-rank test. The median survival time for each group in different situations is shown by the numbers on the curves

