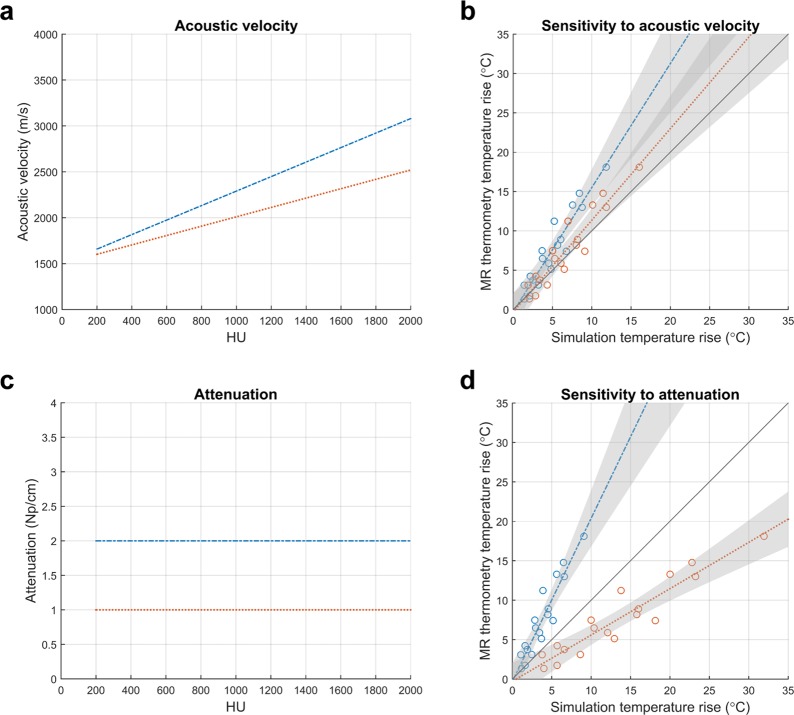
Figure 7.
The effects of skull acoustic properties on simulated temperature rise (patient D). (a) Acoustic velocity curves as a function of HU. The maximum acoustic velocities at 2000 HU are ±10% of the maximum acoustic velocity used in this study. (b) Simulated temperature rises that resulted from using the acoustic velocity curves in (a). (c) Constant attenuation curves as a function of HU. The two constants are within the plausible range of attenuation values (Fig. 6b). (d) Simulated temperature rises that resulted from using the attenuation curves in (c).

