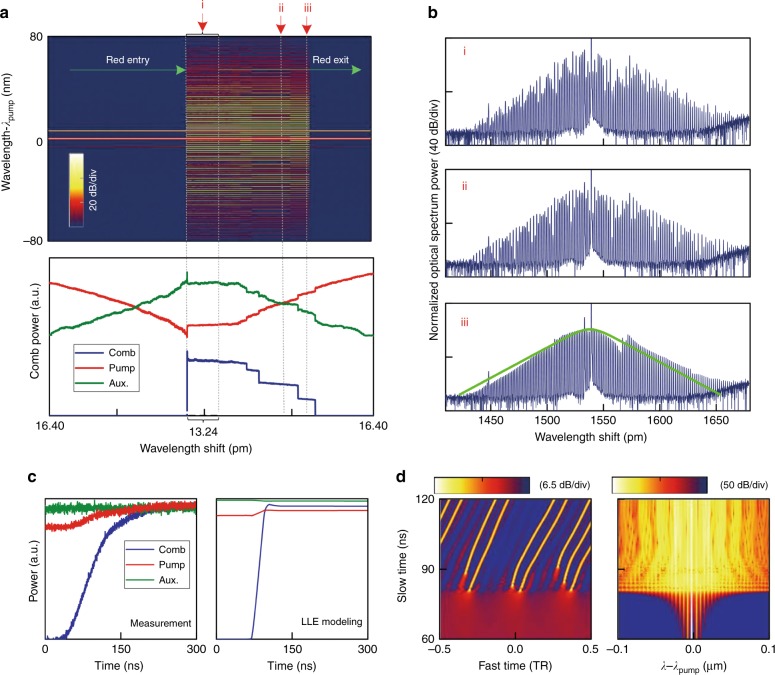
Fig. 4. Spontaneous DKS burst with pump-cavity red-sided entrance.
a The measured Kerr comb spectra (upper) and intracavity laser power evolutions (lower) generated using a 1.0 W pump laser stably scanning from red- to blue-detuning. The pump scan is conducted with a decreasing step wavelength, with a step size of 40 fm (≈5 MHz) and a delay of 0.1 s after each step. The pump laser scan is paused at 13.24 pm (relative shift) for a few seconds, and deliberately returned back to 16.40 pm to incur typical discrete soliton annihilations, which provides evidence for soliton formation during the DKS burst. b Optical spectral snapshots for a DKS burst (i) and subsequent discrete DKS breakdown (ii and iii). The RF spectra are consistently at the noise floor for all three comb states. c Measured (left) and LLE simulated (right) real-time intracavity power evolutions during the process of a DKS burst. Soliton pulses appear and stabilize within ≈50 ns, during which the auxiliary laser power (i.e., cavity resonance) hardly changes, indicating that intracavity energy is conserved. d Waveform and spectrum evolution from the LLE simulation in c illustrating a close view of spontaneous DKS burst from the perturbed pump background

