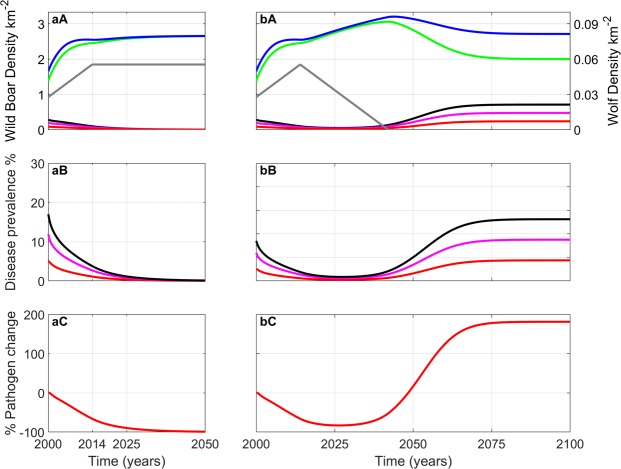
Figure 2.
Model results for the sub-region of Asturias inhabited by wolves. (a) Wolf numbers rise from 196 (2000) to 392 (2014) and then remain constant until 2050. (b) Wolf numbers rise from 196 (2000) to 392 (2014) and then decrease at the rate at which they increased until they die out. Initial conditions set wild boar and wolf densities to their 2000 values taken from the field data, and the initial prevalence (/N) in 2000 is 17% (of which 29% are generalised). (A) changes in wild boar population density - total population (blue); total susceptible (green); total infected and generalised (black); infected (magenta); generalised (red); wolves (grey). (B) changes in total prevalence (black), infected prevalence (magenta) generalised prevalence (red). (C) % change in the density of environmental pathogen. For parameters see Supplementary Information.

