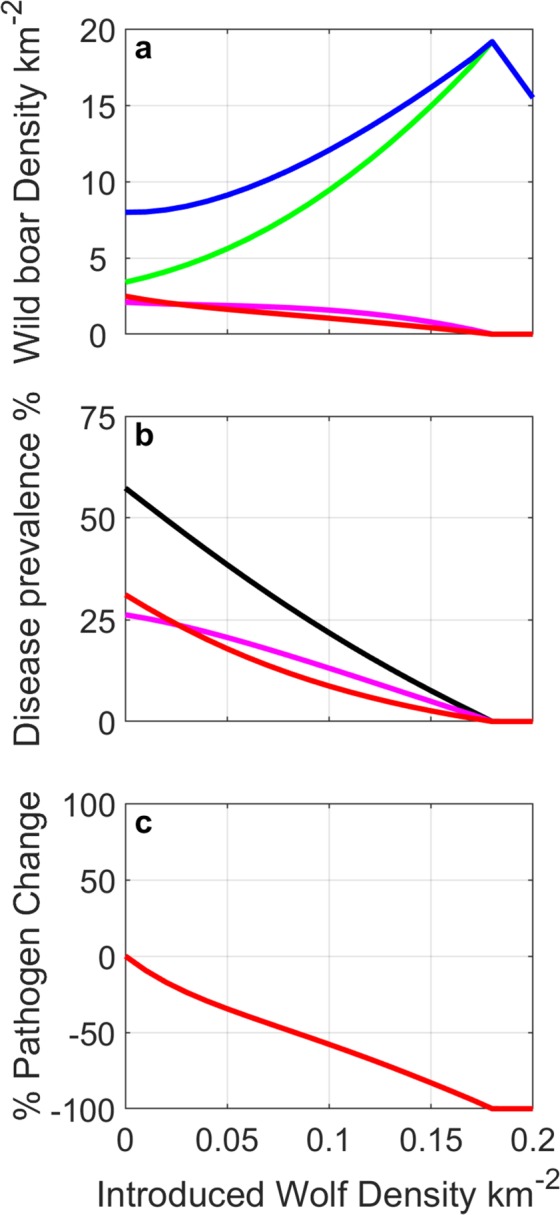
Figure 4.

Model results for areas with high TB prevalence showing the long-term outcome after different constant densities of wolves are introduced to a wild boar population with density steady at 8/km2 and disease prevalence (/N) of 57%. (a) Changes in wild boar population density - total population (blue); total susceptible (green); infected (magenta); and generalised (red). (b) Changes in total prevalence (/N) (black); infected prevalence (I/N) (magenta) generalised prevalence (G/N) (red). (c) % change in the density of environmental pathogen. For parameters see Supplementary Information.
