Figure 1.
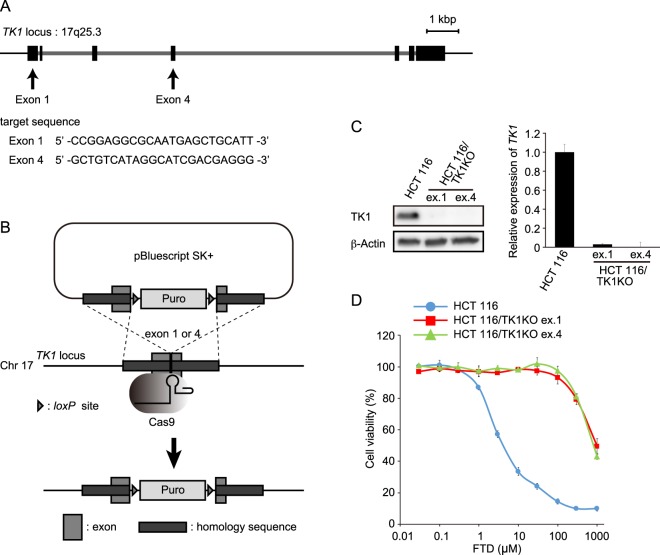
FTD cytotoxicity in TK1-knock-out cells. (A) Schematic diagram of the TK1 locus on Chr17q25.3. Exons are denoted by black rectangles and introns are shown in light grey. (B) Experimental scheme of TK1 knock-out. Three PCR fragments, 600–700 base pairs of the right and left homology arms and a puromycin resistance cassette, were cloned into pBluescript SK+. (C) Western blot analysis of TK1 protein (left) and quantitative RT-PCR analysis of TK1 mRNA (right) in HCT 116 parental and TK1-knock-out cells. Expression of TK1 was normalised against that of β-actin and is plotted relative to that in HCT 116 parental cells. Data are means ± s.d. of three independent experiments. (D) Cell viability assay. Cells were treated with nine points of dilution series of FTD for 3 days and then their viability was determined. The viability of cells not treated with FTD was defined as 100%. Data are means ± s.d. of three independent experiments.

