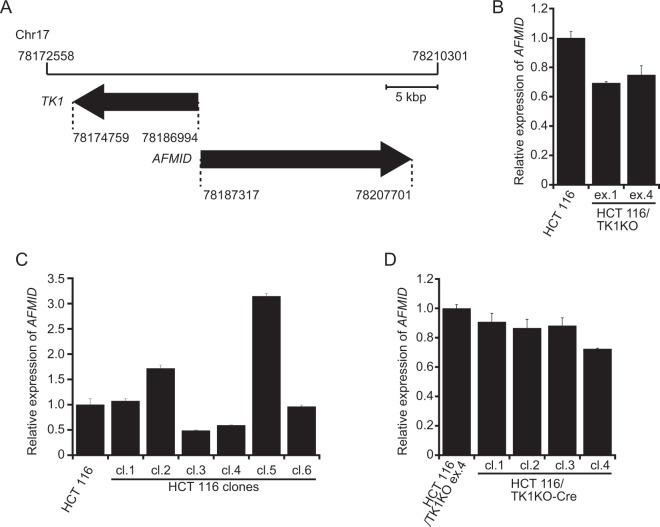
Figure 2.
AFMID expression in TK1-knock-out cells. (A) Schematic diagram around the TK1 locus on Chr17. (B–D) Expression of AFMID was determined by quantitative RT-PCR, normalised against that of β-actin and plotted relative to that in HCT 116 cells. (B) TK1-knock-out cell lines. (C) Cloned HCT 116 cell lines. (D) The HCT 116/TK1KO ex.4 cell line and its clones whose puromycin resistance cassettes were removed by the Cre-loxP recombination system. Data are means ± s.d. of three independent experiments.

