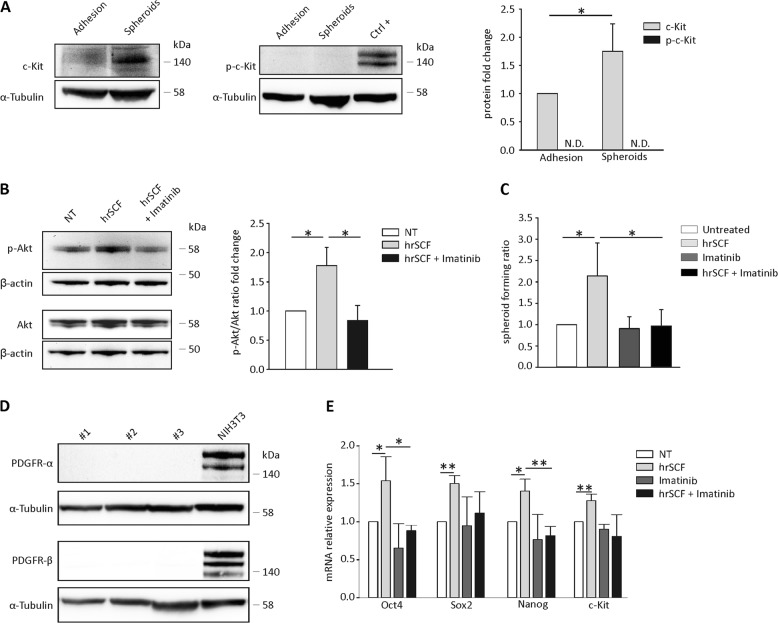
Fig. 4. SCF modulates EOC stemness features.
a Representative WB analysis of c-Kit and p-c-Kit expression in EOC cells cultured either under adherent or spheroid-forming conditions. Kasumi-1 cells stimulated for 5 min with SCF were used as positive control for p-c-Kit (ctrl + ). The bars represent the mean ± S.D. (N = 4). N.D. = not detectable. b WB analysis of p-Akt in EOC cells cultured under spheroid-forming conditions pretreated or not with imatinib (30 μM) and stimulated with hrSCF (50 ng/mL) for 5 min. Signals were normalized to β-actin. A representative blot is shown. The bars represent p-Akt/Akt mean ± S.D. (N = 3). c ELDA performed on EOC cells cultured for two weeks under spheroid-forming conditions in the presence of hrSCF (50 ng/mL), imatinib (5 μM) or the combination of the two. The bars represent the mean ± S.D. (N = 3). d Representative WB analysis of PDGFR-α and β in EOC samples. NIH3T3 were used as positive control. e qRT-PCR analysis of Oct4, Sox2, Nanog, and c-Kit mRNA levels in EOC cells cultured for two weeks as described in a. The bars represent the mean ± S.D. (N = 3). *p < 0.05, **p < 0.01

