FIGURE 3.
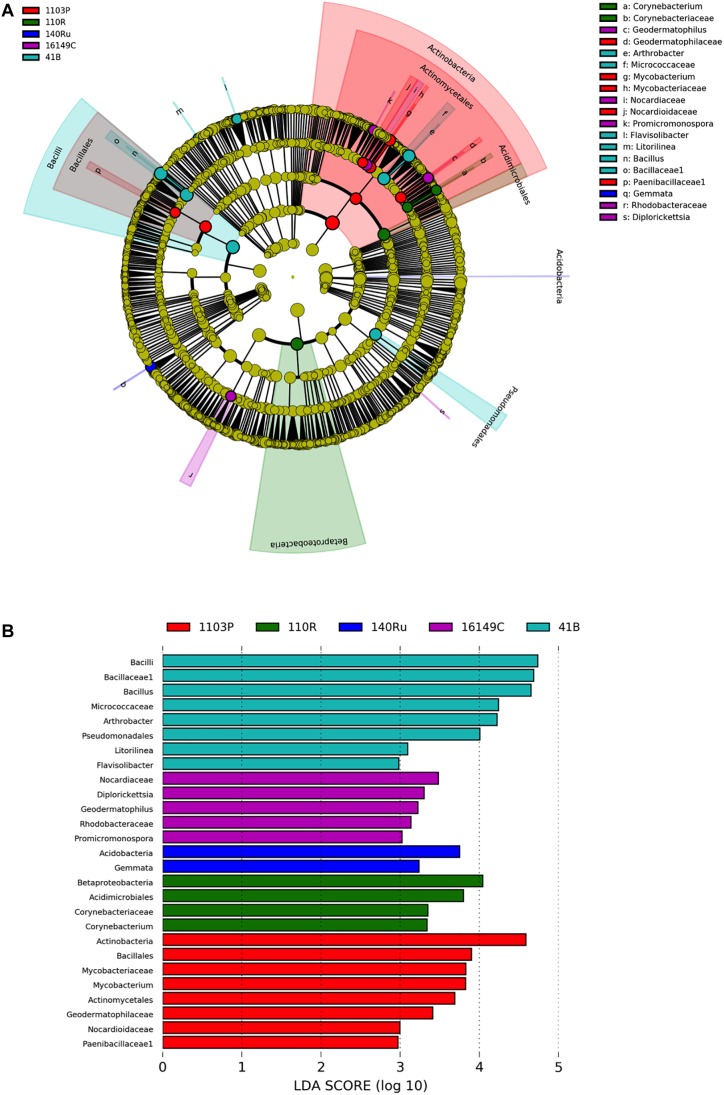
LEfSe was used to identify the most differentially abundant taxa among grapevine rootstocks in Aldea vineyard. Cladogram generated by LEfSe indicating differences of bacteria (A) at phylum, class, family, and genus levels between the five groups (relative abundance ≤0.5%). Each successive circle represents a phylogenetic level. Color regions indicate taxa enriched in the different rootstocks. Differing taxa are listed on the right side of the cladogram. Bar graph showing LDA scores for bacteria (B). Only taxa meeting an LDA significant threshold >2 are shown.

