Figure 3.

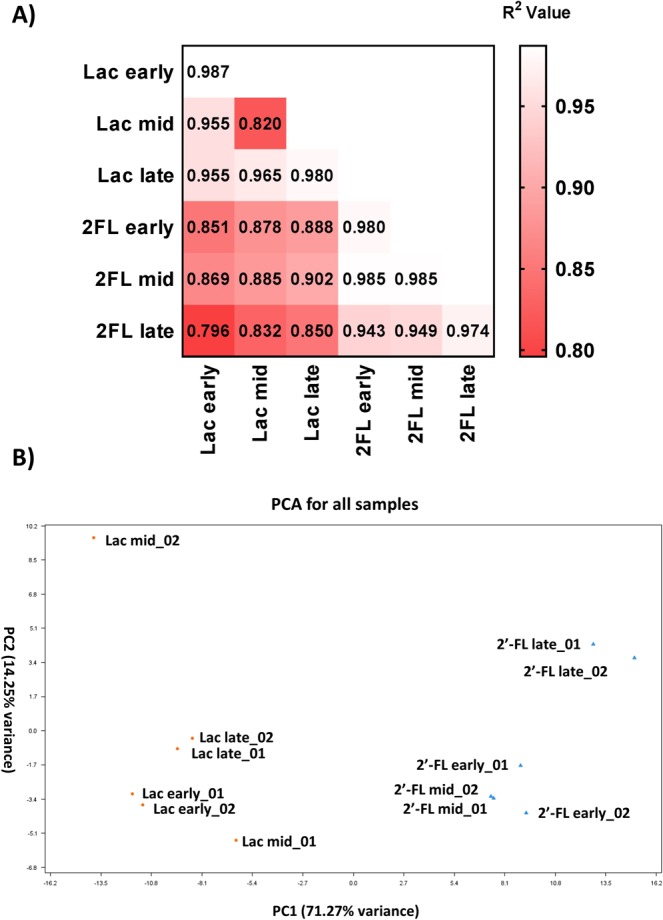
(A) Comparisons of individual samples taken R2 value with the comparison of the individual replicates for each sample type down the middle. (B) PCA plot of all individual samples together to compare their likeness.

(A) Comparisons of individual samples taken R2 value with the comparison of the individual replicates for each sample type down the middle. (B) PCA plot of all individual samples together to compare their likeness.