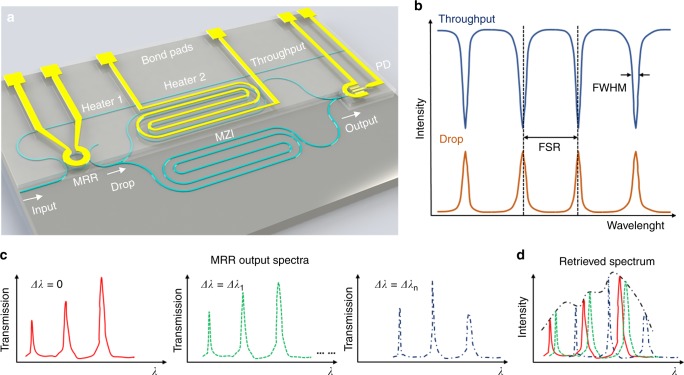
Fig. 1.
Microring resonator-assisted Fourier-transform spectrometer. a Schematic of the RAFT spectrometer consisting of an MRR and an MZI both with heaters on top integrated with a PD. b Schematic transmission spectra of the MRR. Free spectral range (FSR) is the separation between adjacent dips (peaks) and full width half maximum (FWHM) denotes the linewidth of the dips (peaks). c Schematic of output filtered spectra from the drop port of the MRR at three tuning states (0 < ∆λ1 < …… < ∆λn < FSR), which are denoted by lines with different styles (colors). d Schematic retrieved spectra at different tuning states (denoted by lines with different styles (colors)) by the tunable MZI. The original input spectrum (denoted by black dotted line) can be retrieved by combining all the retrieved spectra

