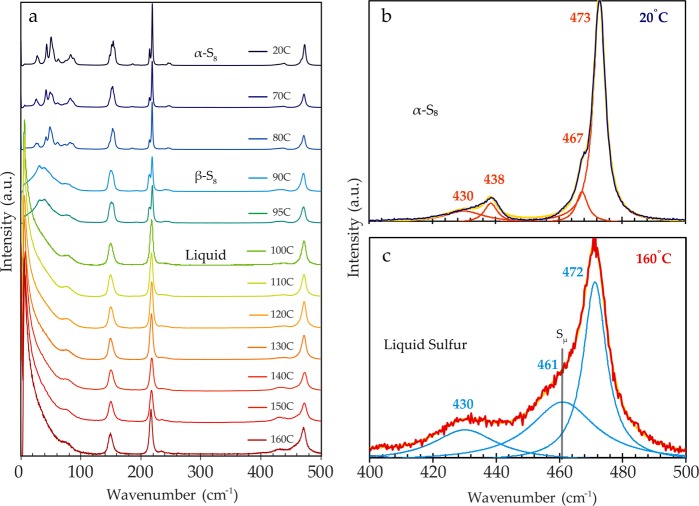
Figure 2.
(a) Raman spectra from an in-situ experiment at increasing temperatures. The experiment begins with solid α-S8, with an observable transition to β-S8, and then a transition to liquid S8. Spectra are normalized to the 150 cm−1 peak; (b) A plot of the 20 °C α-S8 spectrum and (c) the 160 °C liquid sulfur spectrum normalized to the characteristic 473 cm−1 S8 feature, showing Lorentzian functions (orange and blue respectively) and the cumulative fit in yellow. Plot (c) shows the presence of a shoulder feature (461 cm−1), which denotes the accretion of disordered polymeric sulfur chains (Sμ) in the high temperature liquid sulfur.

