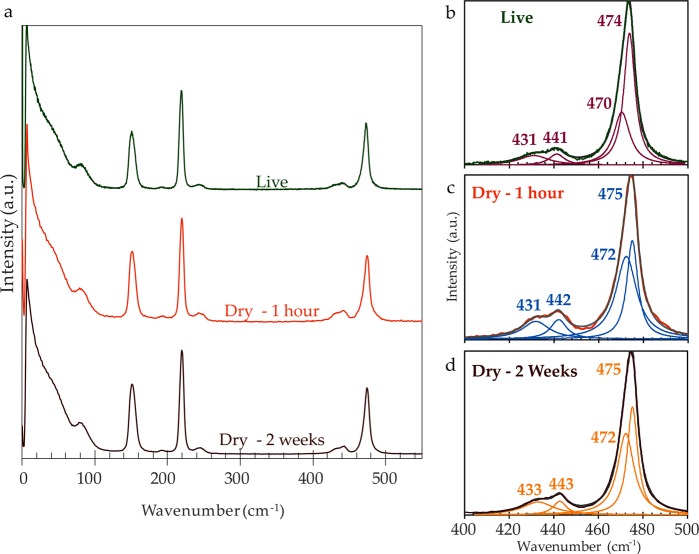
Figure 8.
(a) The spectra of intact Thiothrix sulfur globules measured through a range of hydration states: live (top), dried on slide for one-hour (middle), and dried on slide for two weeks (bottom); (b–d) Peak fits in the 400–500 cm−1 range. Experimental data corresponds to color of the spectrum plotted in 8a; each fit profile is shown in gray; and Lorentzian peaks are shown in purple, blue, and orange. Spectra in (a) and (b–d) were normalized to the characteristic S8 473 cm−1 peak.

