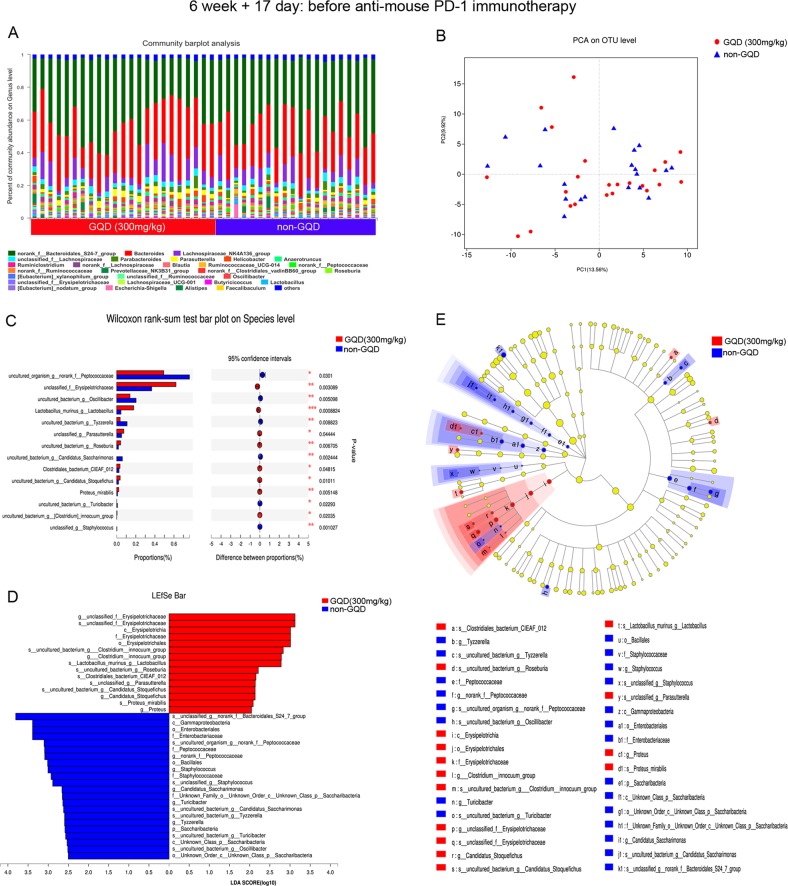
Fig. 3. GQD modulates the gut microbiome composition.
a Stacked bar plot of the phylogenetic composition of common bacterial taxa at the genus level in faecal samples at immunotherapy initiation. b Principal coordinate analysis (PCA) at the OTU level. c Bar plot of compositional differences at the species level in the gut microbiome of mice in the GQD (300 mg/kg) vs. the non-GQD group based on the Wilcoxon rank-sum test. d LDA scores computed for differentially abundant taxa in the faecal microbiomes from the GQD (300 mg/kg) and non-GQD groups. P = 0.05 for the Kruskal–Wallis test; LDA score > 2. e Taxonomic cladogram from LEfSe showing differences in faecal taxa. Dot size is proportional to the abundance of the taxon

