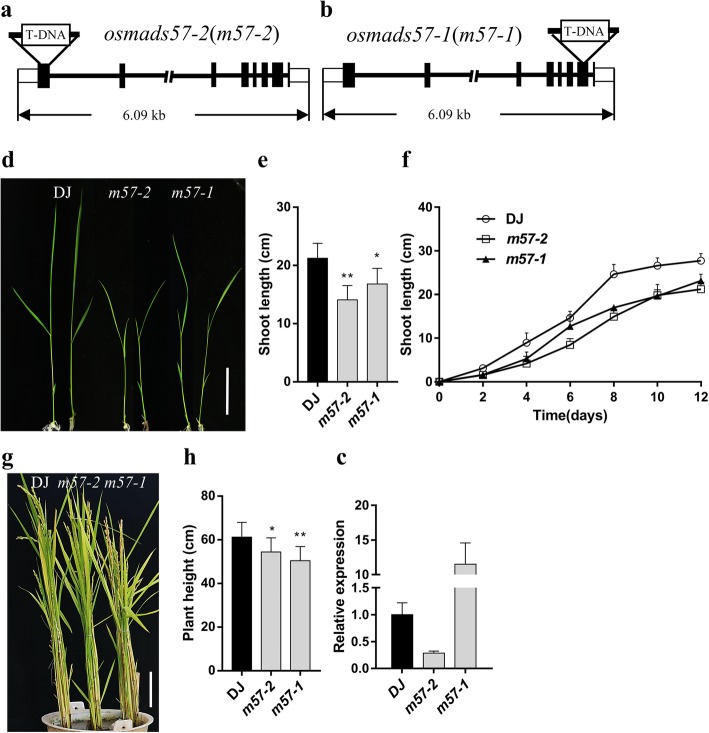
Fig. 1.
Phenotypes of the m57–2 and m57–1 mutants. a and b Schematic diagram indicating the T–DNA insertion site in genomic region in m57–2 (a) and m57–1 (b). c Transcript levels of OsMADS57 in mutants and wild type lines by Q–PCR analysis. d The 10-day-old wild type and osmads57 plants grown in standard 1/2 MS medium. Bars = 5 cm. e Shoot length of 10-day-old wild type and osmads57 seedlings. f Shoot length of wild type and osmads57 plants grown in standard 1/2 MS medium for different days. g Morphology of wild type and osmads57 plants at maturity. Bars = 10 cm. h Plant height of wild type and osmads57 plants at maturity. DJ, wild type; m57–2, osmads57–2; m57–1, osmads57–1. Three independent experiments were conducted with similar results. The data are means± SD (n = 30). Error bars indicate SD. The statistical significance of the measurements was determined by Student’s t-test. Asterisks indicate the significant difference between osmads57 and wild type (t–test, * P < 0.05, ** P < 0.01 or *** P < 0.001)

