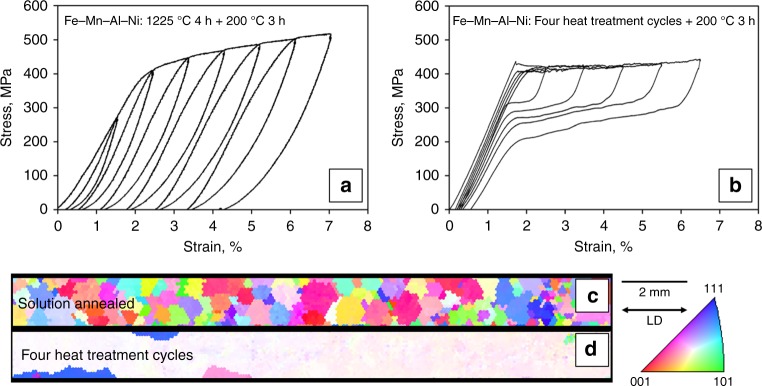
Fig. 1.
Pseudoelastic response of Fe–Mn–Al–Ni tension samples with different grain sizes. Stress–strain curves of Fe–Mn–Al–Ni after a solution treatment at 1225 °C for 4 h in a and after a cyclic heat treatment for four times in b. c, d show the corresponding electron-backscatter diffraction orientation maps of the samples plotted for the loading direction (LD). The colors correspond to the crystal directions given in the stereographic triangle. Details on the cyclic heat treatment procedure are shown in Supplementary Fig. 1a

