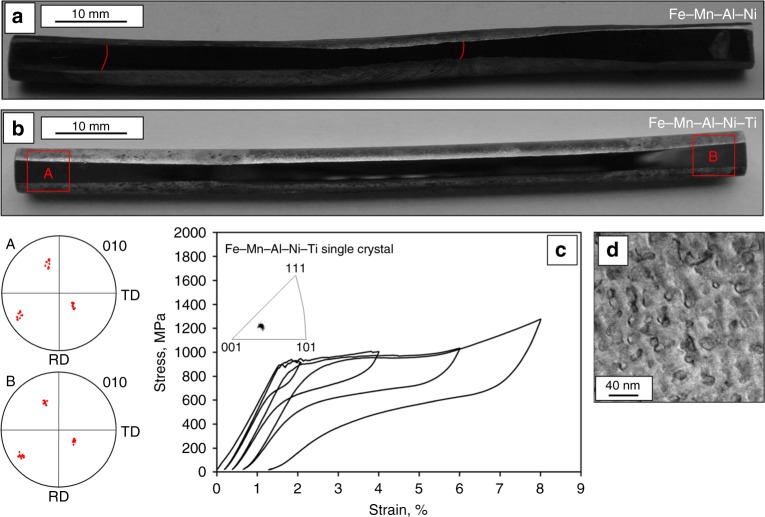
Fig. 8.
Abnormal grain growth in Fe–Mn–Al–Ni and a Fe–Mn–Al–Ni–Ti bars and corresponding pseudoelastic behavior of Fe–Mn–Al–Ni–Ti. Overview images of a Fe–Mn–Al–Ni bar (a) and Fe–Mn–Al–Ni–Ti bar (b), both featuring a length of 100 mm and a diameter of 6.3 mm, after the cyclic heat treatment procedure shown in Supplementary Figure 1d. Grain boundaries are highlighted by red lines. 〈0 1 0〉 pole figures were taken from the areas highlighted by the red squares on the Fe–Mn–Al–Ni–Ti bar. c Incremental strain test of a single crystalline Fe–Mn–Al–Ni–Ti compression sample up to 8% applied strain. The inset in c shows an inverse pole figure of the tested compression sample plotted with respect to the loading direction. d Characteristic scanning transmission electron microscopy image revealing the size of the β precipitates of the sample tested in c

