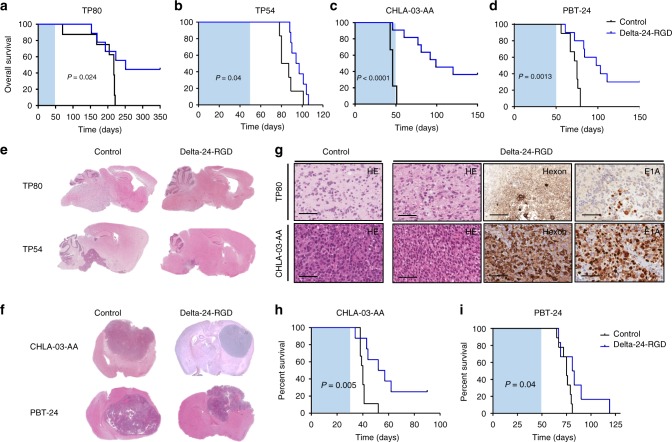
Fig. 3.
Delta-24-RGD increases overall survival in DIPG and pHGG models. Tumors were developed by orthotopic intracranial injection of 500,000 cells in female nude mice. a Kaplan–Meier survival curves of Delta-24-RGD (108 pfu)- and control (PBS)- treated athymic mice bearing a TP80 (Control N = 8, Delta-24-RGD-treated N = 9), b TP54 (Control N = 8, Delta-24-RGD-treated N = 9), c CHLA-03-AA (Control N = 9, Delta-24-RGD-treated N = 11), and d PBT-24 (Control N = 9, Delta-24-RGD-treated N = 10). Animals were treated 3 days post-tumor cell injection. The shaded area represents a 50-day interval from the time of cell implantation. Log-rank test was used as statistical analyses. e Representative images of the histopathological analyses of TP80 and TP54 (H&E) of longitudinal slides of control (left images) and Delta-24-RGD-treated tumors (right image). f Representative images of the histopathological analyses of CHLA-03-AA and PBT-24 (H&E) (magnification × 1) of control (left image) and Delta-24-RGD-treated (right images). Mice were treated with either PBS (control) or Delta-24-RGD 3 days post injection. For comparison studies, analyzed brains are derived from mice that died at a similar time point in both groups: CHLA-03-AA = 50 ± 10 days; PBT-24 = 60 ± 5 days; TP80 = 200 ± 5 days; TP54 = 90 ± 5 days. g Representative images of H&E, hexon, and E1A immunostaining of TP80 or CHLA-03-AA tumors, non-treated, or treated with Delta-24-RGD (scale bars, 100 μm). Images correspond to the brains shown in e, f. h, i Kaplan–Meier survival curves of established tumors h CHLA-03-AA (Control N = 10, Delta-24-RGD-treated N = 10) and i PBT-24 (Control N = 8, Delta-24-RGD-treated N = 9) treated with Delta-24-RGD 15 days post cell implantation. The shaded area represents a 50-day interval from the time of cell implantation. Source data are provided as a Source Data file

