Fig. 5.
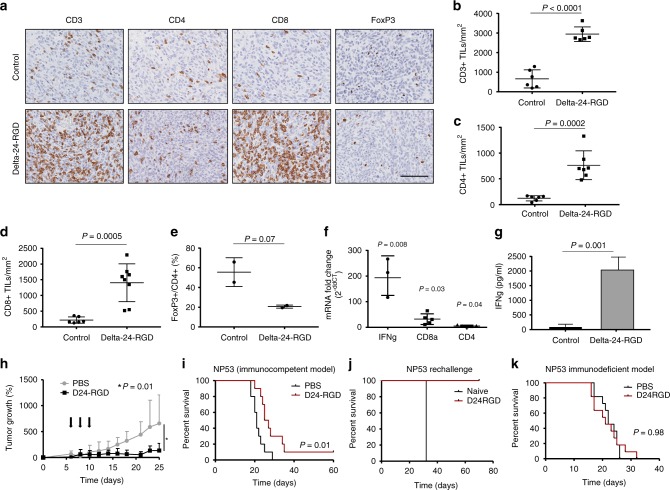
Delta-24-RGD effect DIPG immunocompetent models. Brain tumors were developed by intracranial injection of the NP53 cell line, and PBS or Delta-24-RGD were administered intratumorally 3 days after cell implantation and animals were killed at day15 after cell implantation (a–h). a Representative images (scale bar, 100 µm) of CD3, CD4, CD8, and FoxP3 immunostaining of DIPG tumors from control mice or Delta-24-RGD-treated mice. b Quantification of positive CD3+, c CD4+, d CD8+, and e FoxP3/CD4+ cell infiltration per mm2 of DIPG tumors. Graph showing the quantification of positive cells infiltrating 15 days after cell implantation per mm2 of PBS or Delta-24-RGD-treated tumors (n = 3). P values were calculated using two-tailed Student t test. f Quantification of IFN gamma (mean fold change 193.7), CD8a (mean fold change 29.1), and CD4 (mean fold change 2.9) mRNA expression. The data shown represent the mRNA expression in tumors treated with Delta-24-RGD normalized to PBS-tumor mRNA expression (N = 3). Two-tailed Student t test was used for comparison between control and treated mice. g ELISA quantification of IFN gamma production in splenocytes from control and Delta-24-RGD-treated animals co-cultured with tumor cells. P values were calculated using two-tailed Student t test. h NP53 cells (5 × 10⁶) were implanted subcutaneously in mice flank. Seven days later subcutaneous tumors were visible and ranged between 40 and 80 mm3. Mice were randomized in two groups and treated with three administrations of Delta-24-RGD. Tumor volumes were measured every 2–3 days until the end of the experiment (day 25). Tumor volume (N = 8) was calculated by the equation V (mm3) = π/6 × W2 × L; W is tumor width and L is tumor length. Graph showing percentage of tumor growth was calculated as (V−V0/V0 × 100) where V0 is the tumor volume present when treatment starts, comparison between groups were performed with two-tailed Student t test. i Brain tumors were developed by intracranial injection of the NP53 cell line, and PBS or Delta-24-RGD were administered intratumorally 3 days after cell implantation. Kaplan–Meier survival curves of Delta-24-RGD (107 pfu)- and control (PBS)- treated immunocompetent mice (N = 10, both groups) bearing intracranial NP53 tumors. P value was calculated with the log-rank test. j Rechallenge experiment of the long-term survivor from i. The long-term survivor from the Delta-24-RGD-treated group was subjected to a rechallenge with NP53 cells and compared with a control untreated mice. k Kaplan–Meier survival curves of Delta-24-RGD (107 pfu)- and control (PBS)-treated immunodeficient (athymic nude) mice (N = 11; both groups) bearing intracranial NP53 tumors. P value was calculated with the log-rank test. Source data are provided as a Source Data file

