FIG 4.

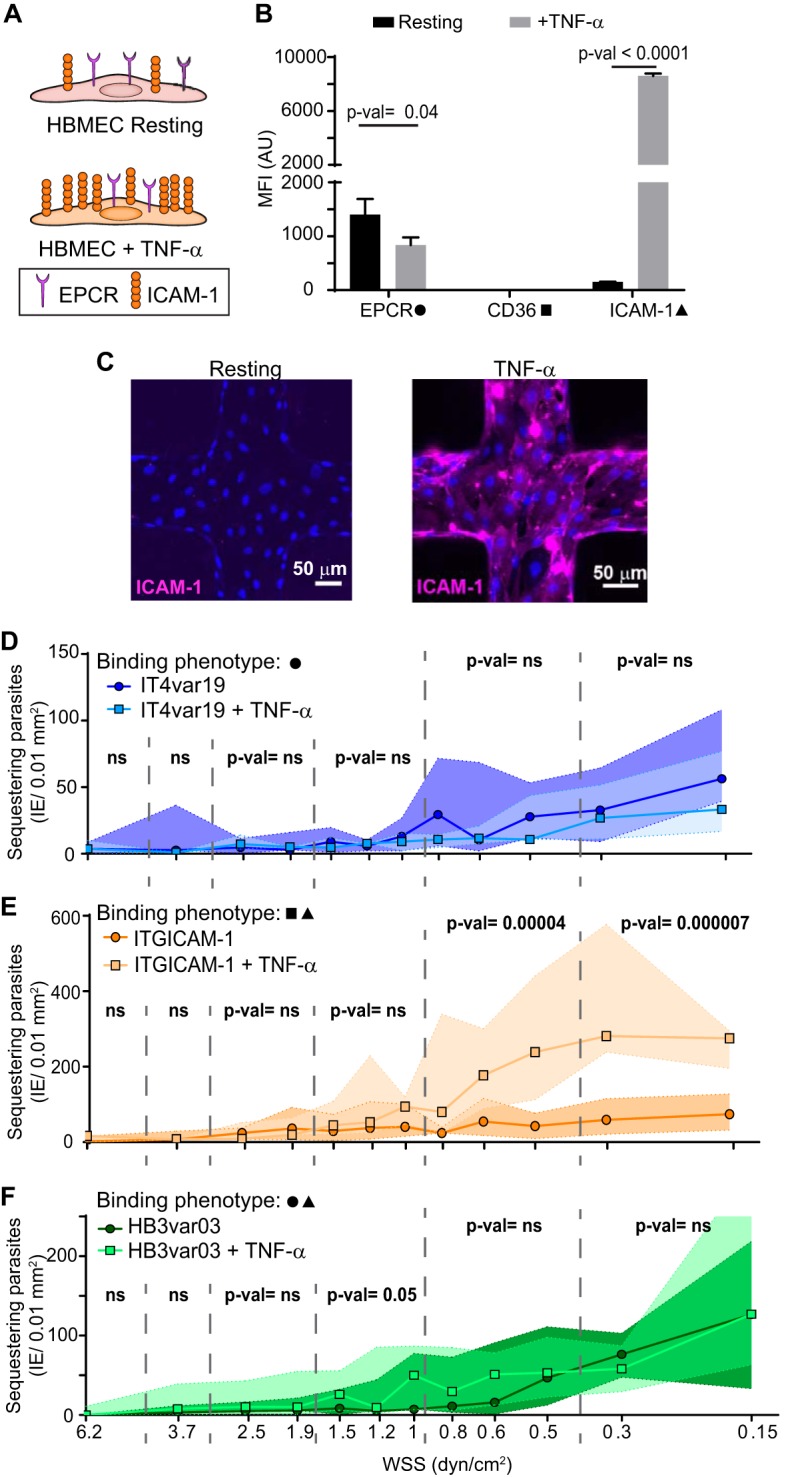
P. falciparum binding to resting and TNF-α-stimulated 3D brain microvessels. (A) Schematic representation of surface expression of receptors on primary HBMEC under resting and activated conditions. (B) Surface receptor expression measured by flow cytometry on resting HBMEC monolayers and after 18 h of stimulation with TNF-α. Bars represent mean ± standard deviation (SD) (n = 3 biological replicates). Statistical analysis was determined by an unpaired t test. MFI (AU), mean fluorescence intensity (arbitrary units). (C) IFA z-projection of resting and activated 3D brain microvessels stained with an anti-ICAM-1 antibody (magenta). (D to F) Binding levels of IE to resting and TNF-α-activated (18 h) 3D microvessels. Dots represent median binding levels, and the colored area represents the interquartile range (n = 4 to 5 independent biological replicates). Statistical analysis of binned regions was determined by Mann-Whitney test.
