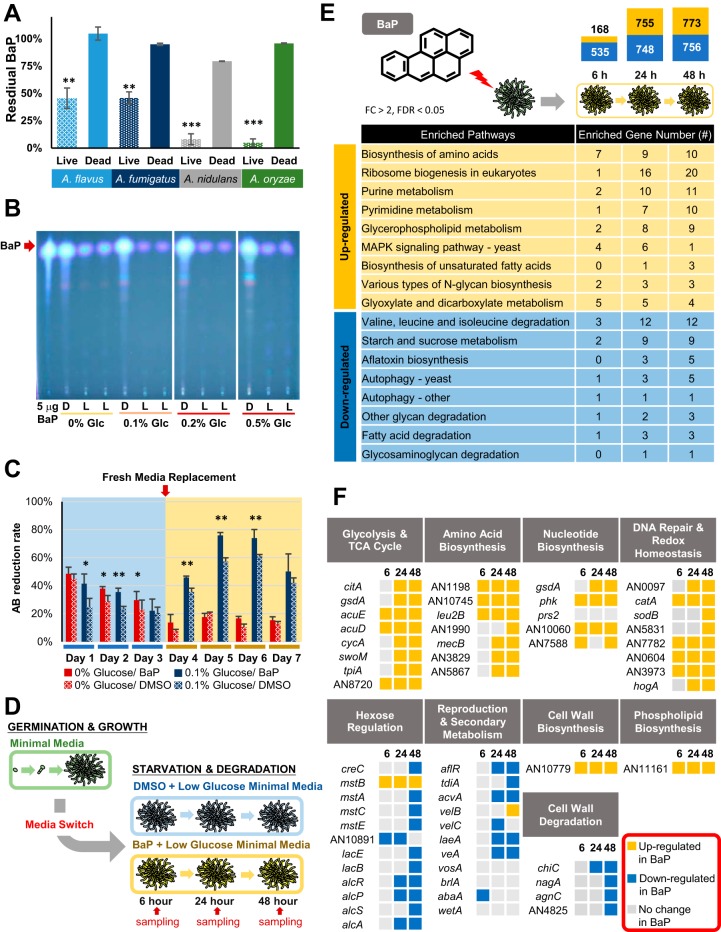
FIG 2.
Degradation and utilization of BaP by Aspergillus. (A) Percentage of BaP remaining after 7-day cultures of each species. Three separate experiments were performed in triplicate. Mean values are plotted with standard errors of the mean (SEM) throughout all the graphs in the paper. **, P < 0.01; ***, P < 0.001. (B) Thin-layer chromatograms of residual BaP after 7-day cultures of A. nidulans in MM with various glucose concentrations. For reference, the 5-μg BaP standard is shown. Note the differences of the BaP intensity in dead cells (D) versus live cells (L). MM with 0.1% glucose with 200 μM BaP consistently resulted in the most effective degradation of BaP in multiple experiments. (C) alamarBlue reduction of A. nidulans cells treated with BaP and DMSO with (blue) or without (red) 0.1% glucose. Experiments were performed in triplicate. *, P < 0.05; **, P < 0.01. (D) Experimental overview for RNA sequencing. Samples were collected in triplicate at each time point. (E) KEGG pathways with upregulated (yellow) and downregulated (blue) DEGs at each time point. The bar chart indicates the total number of DEGs (log2 fold change [FC] of >1 or <−1 and P value of <0.05) at each time point. (F) Categories of transcriptional responses previously seen in carbon-starved A. nidulans cells and relative expression of specific genes in BaP- versus control (DMSO)-treated cells.

