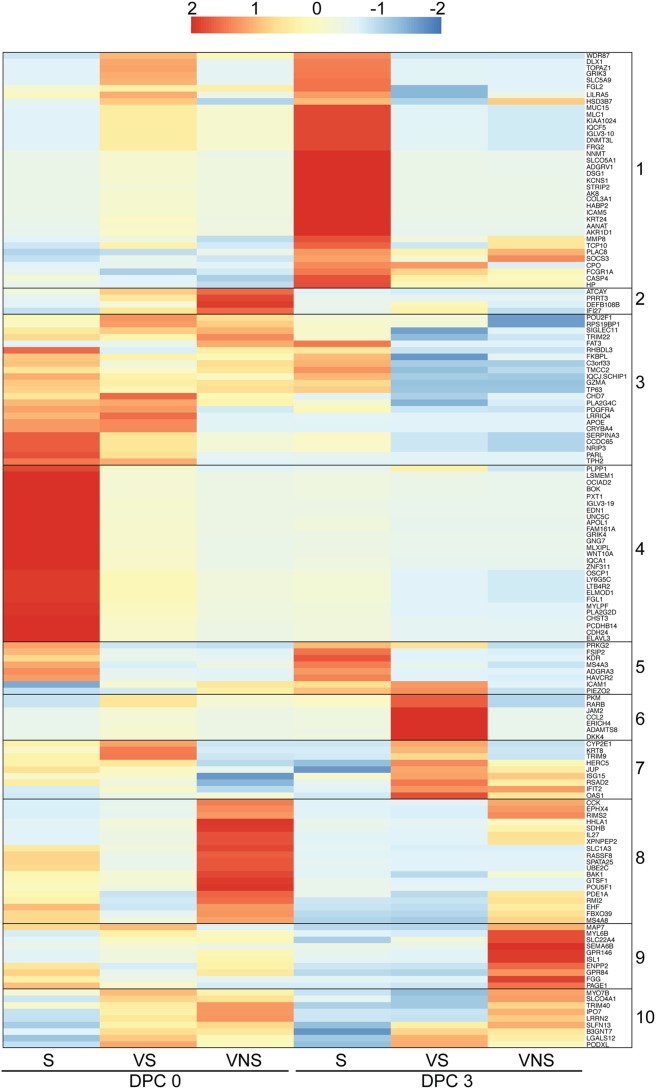
FIG 2.
Animals vaccinated 3 days before challenge display distinct transcriptional responses that correlate with disease outcome. Shown is a heat map representing hierarchical clustering of genes significantly associated with clinical outcome identified by maSigPro on 0 and 3 DPC. Clusters of genes that are coregulated are numbered 1 to 10. The range of colors is based on rlog transformation of normalized read counts: red represents increased expression, while blue represents decreased expression. Each column represents the nonviremic survivor (S), viremic survivor (VS), or viremic nonsurvivor (VNS).

