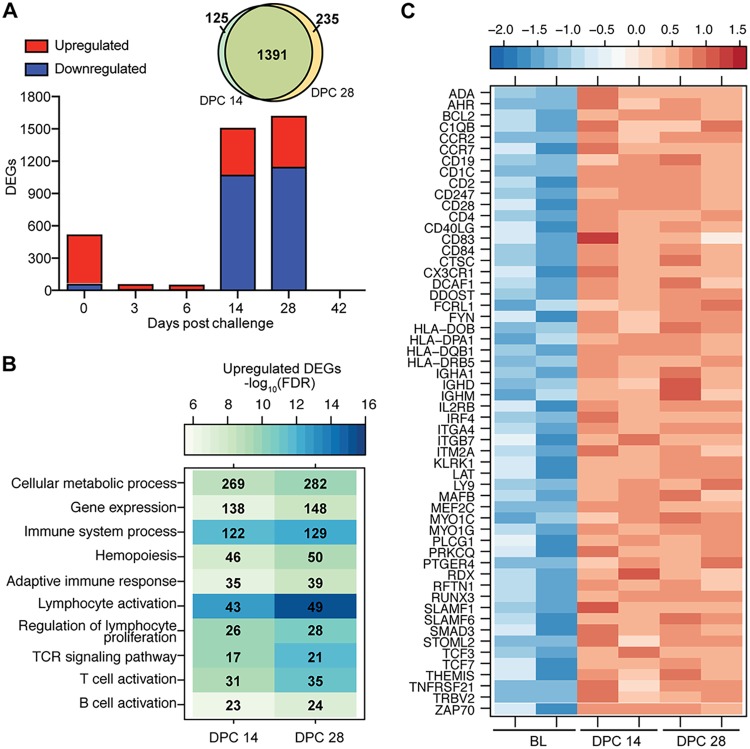
FIG 3.
EBOV-Makona challenge 1 week after vaccination induces a recall response. (A) Number of DEGs detected in day −7-vaccinated animals following EBOV-Makona challenge. A Venn diagram displays overlap between DEGs detected 14 and 28 DPC in the day −7 group. (B) Functional enrichment of upregulated DEGs detected 14 and 28 DPC in the day −7 group. (C) Heat map representing upregulated DEGs detected 14 and 28 DPC in the day −7 group that enriched to “T-cell differentiation,” “B-cell activation,” and “Adaptive immune response.” Each column represents 1 animal; BL represents the transcriptional profile of the day −28 animals at 0 DPC.

