FIG 1.
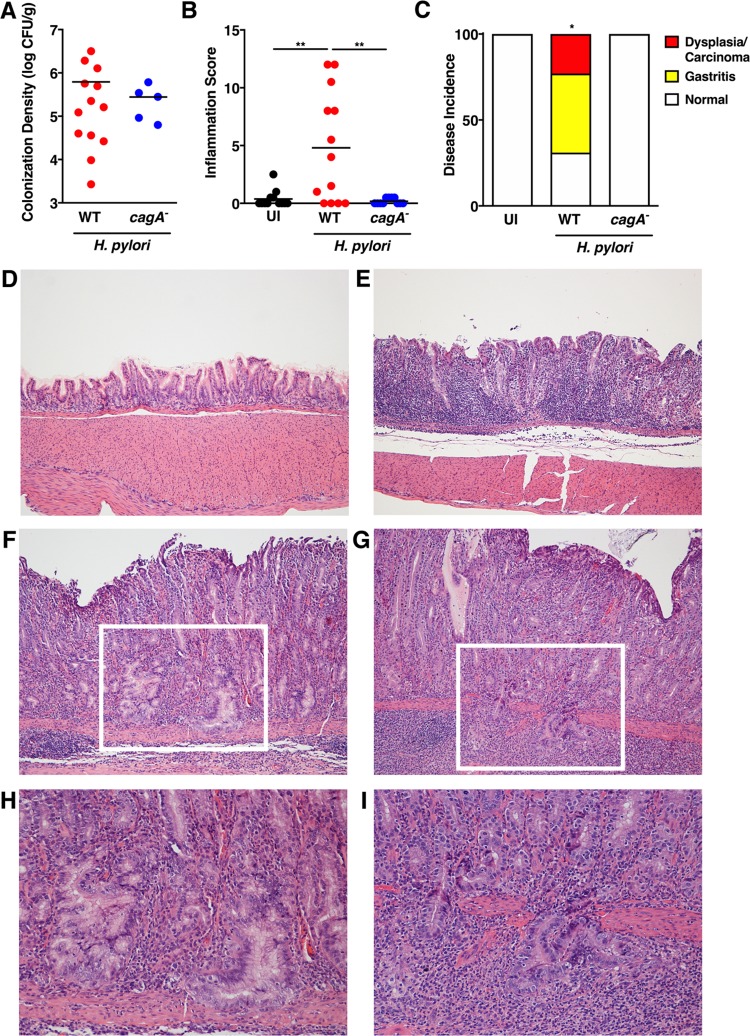
H. pylori colonizes gerbils and induces gastric inflammation and injury in a cagA-dependent manner. (A) Gastric tissue from uninfected gerbils (n = 12) or gerbils infected with wild-type (WT) H. pylori strain 7.13 (n = 13) or the 7.13 cagA isogenic mutant (n = 11) for 6 weeks was homogenized and plated on selective Trypticase soy agar plates with 5% sheep blood for isolation of H. pylori. Of the 11 gerbils challenged with the cagA isogenic mutant, CFU were detectable by quantitative culture in 5 animals. Plates were incubated for 3 to 5 days, and colonization density was determined and expressed as log CFU per gram of gastric tissue. Each data point represents colonization density from an individual animal. (B and C) Linear strips of gastric tissue, extending from the squamocolumnar junction to the proximal duodenum, were fixed in 10% neutral buffered formalin, embedded in paraffin, and stained with hematoxylin and eosin. (B and C) A pathologist, blind to the treatment groups, assessed indices of inflammation (B) and disease incidence (C). (B) The severity of acute and chronic inflammation was graded 0 to 3 (0 for no inflammation, 1 for mild, 2 for moderate, or 3 for marked inflammation) in both the gastric antrum and corpus. Each data point represents inflammation scores from an individual animal. For these analyses, both culture-positive and OTU-positive cagA mutant-infected gerbils were included. Values that are significantly different are indicated by bars and asterisks as follows: **, P < 0.001. (C) The incidence of gastric disease was also assessed, and the definitive histologic diagnosis represents the most severe lesion detected within the gastric tissue section. *, P = 0.005 for WT versus uninfected (UI) and cagA isogenic mutant. (D to G) Representative histologic images of normal gastric epithelium (D), gastritis (E), dysplasia (F), and adenocarcinoma (G) are shown at ×100 magnification (D to G). (H and I) Representative histologic images of dysplasia (H) and adenocarcinoma (I) are also shown at ×200 magnification and represent the area designated in the white boxes (F and G). Mann-Whitney U test and Fisher’s exact tests were used to determine statistical significance between uninfected and H. pylori WT- and cagA mutant-infected groups.

