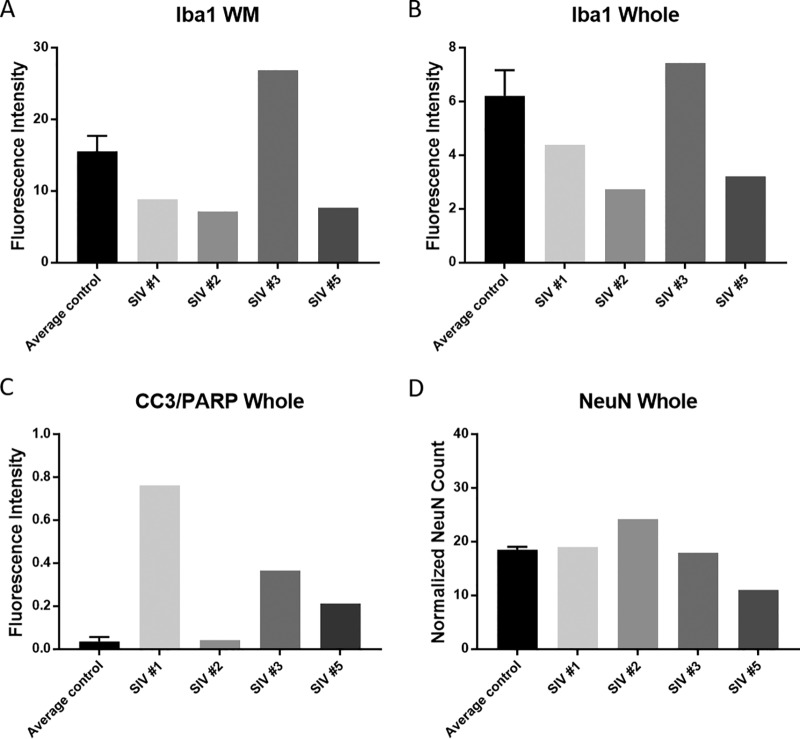
FIG 3.
Quantitative assessment of Iba1 (microglia/macrophages) (A and B), CC3/PARP (apoptosis) (C), and NeuN (neuron) (D) staining in SIV-infected animals compared to average control values (WM, white matter; whole, striatum and white matter). Error bars represent standard deviation values derived from two control animals.

