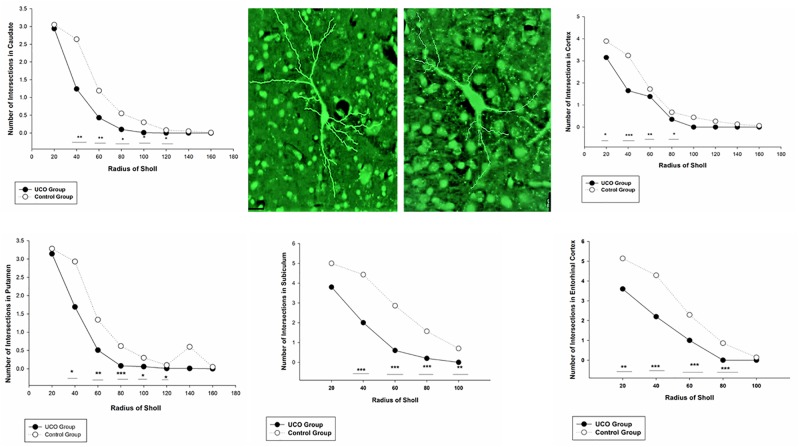
FIGURE 6.
Branching pattern alterations of STT interneurons in cortex, caudate, putamen, subiculum, and EC using Sholl analysis in UCO and control groups. The number of branching intersections at various distances away from the cell soma was significantly lower in the UCO group vs. control group. ∗p < 0.05, ∗∗p < 0.01, ∗∗∗p < 0.001. Example of morphological analysis of STT interneuron in the putamen area of brain from control (left) and UCO (right) animals. Scale bar = 20 μm.

