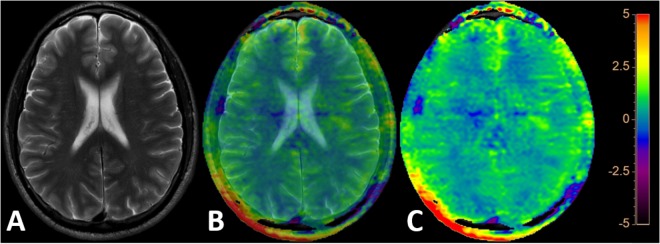
FIGURE 1.
The pure 2D T2w TSE image (A), a mixed 2D T2w TSE and APTw image (both each 50% contributing as shown in B) and the pure APTw color coded image (C) are depicted after fusion and coregistration of the 2D T2w TSE and the APTw image. “Rainbow” color coding is used depicting the APTw signal intensity from -5 to +5%.

