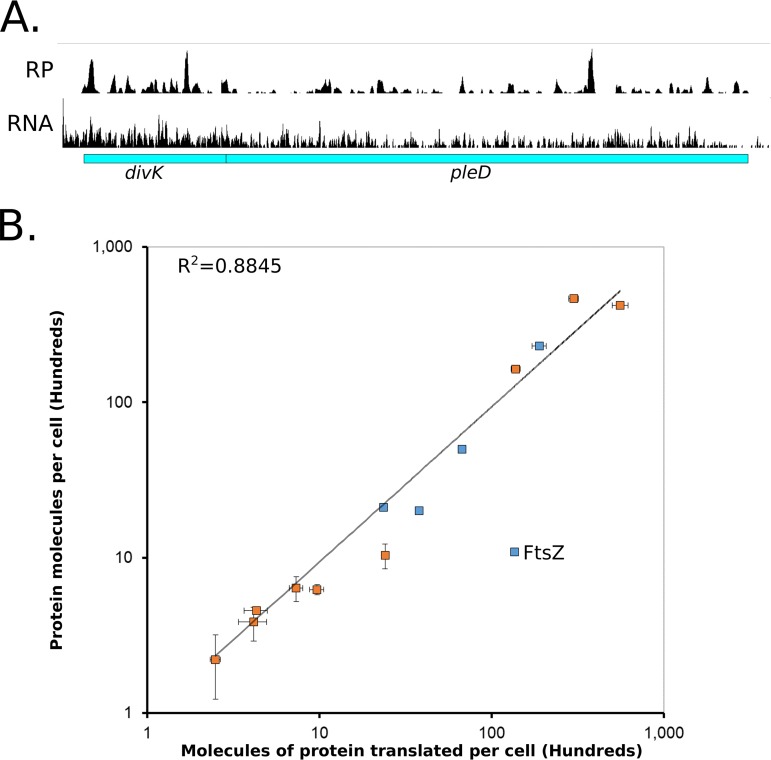
FIG 1.
Absolute quantitation of C. crescentus protein synthesis by ribosome profiling. (A) Ribosome profiling data for cells grown in M2G medium of the divK/pleD operon. Average ribosome density of divK is 2.0 times higher than for pleD. mRNA data are from reference 36. (B) Absolute protein levels of unsynchronized cells measured by Western blotting (blue) or YFP fusions (orange) compared to the absolute molecules of protein translated per cell calculated by ribosome profiling. Vertical error bars indicate the standard deviation in YFP intensity or standard deviation for the Western blots, while horizontal error bars indicate the standard deviation from ribosome profiling replicates (n = 3). FtsZ is expected to deviate from the line since its protein levels are under proteolytic control (17). Data are in Tables S1 and S2.

