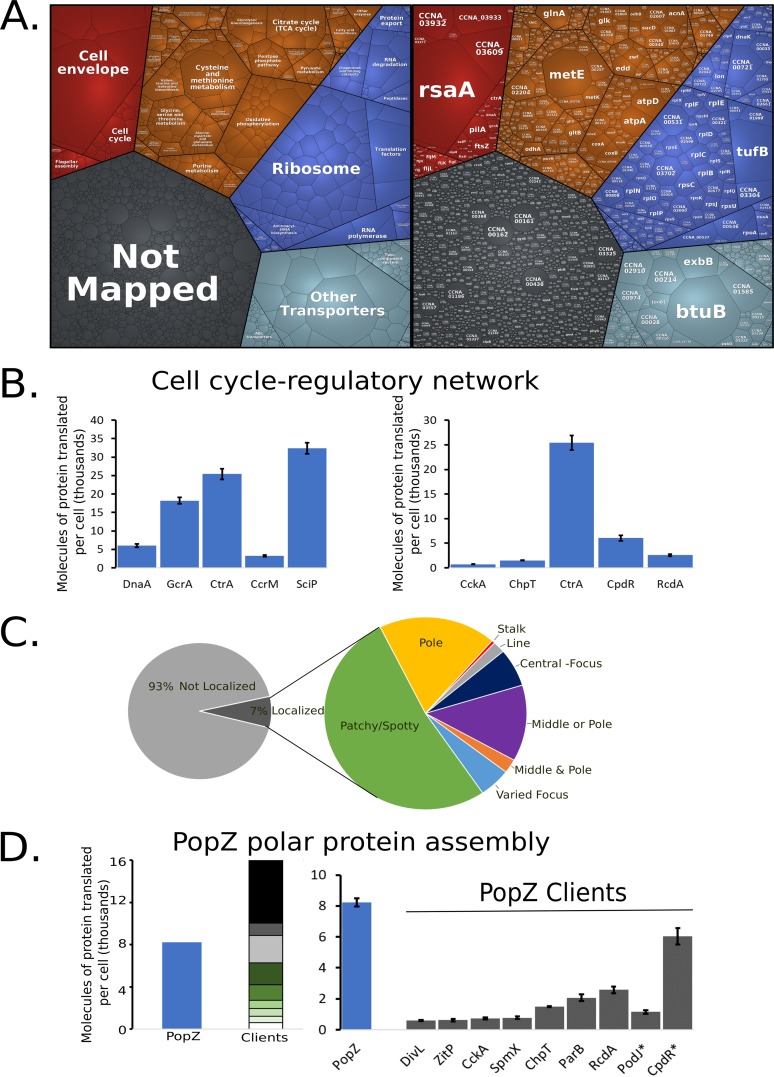
FIG 2.
Global analysis of C. crescentus protein synthesis. (A) Proteomap with each polygon representing a single gene with area scaled to the fraction of ribosome-protected mRNA footprints measured. Red is cellular processes, orange is metabolism, blue is genetic information processing, light blue is environmental information processing, and gray is genes of unknown function. (B) Molecules of protein translated per cell for the cell cycle master regulators (left) and CtrA regulatory network (right). (C) (Left) Fraction of ribosome-protected mRNA footprints encoding localized (dark gray) or nonlocalized (light gray) proteins. (Right) Zoomed-in analysis of the fraction of proteins with different subcellular localization patterns based on reference 26. (D) Polar protein competition. (Left) Molecules of protein translated per cell for the polar protein scaffold PopZ and its known clients (27–29). Proteins with known proteolysis are highlighted with asterisks.

