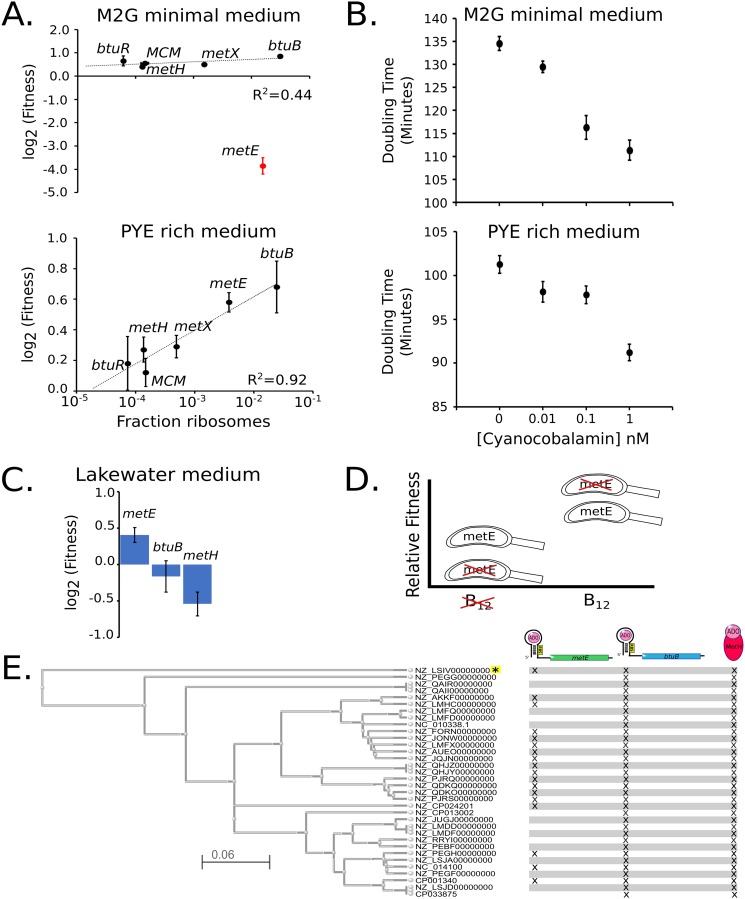
FIG 4.
Excess protein synthesis rates for methionine-biosynthetic genes correlate with fitness cost. (A) Protein synthesis cost measured in the fraction of ribosomes (Table S1) on the x axis versus the Tn-seq-derived fitness values for the btuB B12 importer and methionine-biosynthetic genes under growth in minimal or rich medium as measured previously (39) (biological replicates, n = 2 for M2G, n = 10 for PYE). Black points represent nonessential genes for methionine biosynthesis, and red points represent genes required for methionine biosynthesis under the specified growth condition. Error bars represent standard deviation. Curve fits were performed only on nonessential genes. (B) Doubling times of C. crescentus cells in M2G and PYE media with indicated concentrations of B12. Error bars represent the standard deviation for doubling time measurements (biological replicates, n = 3 for each condition). (C) Tn-seq-derived fitness values for metE, btuB, and metH under growth in Lake Michigan lake water as measured previously (57). (D) Fitness tradeoff of facultative versus obligate B12 scavenging. Relative fitness shown for species with metE (facultative) or without metE (obligate) in environments lacking or containing sufficient B12. (E) Phylogenetic tree of all Caulobacter species with completed genomes based on btuB and metH protein sequences. Each species is labeled by its NCBI accession identifier, and the scale represents the Kimura distance. Marks next to species represent the presence of a metE, btuB, or metH gene. All species have a predicted B12 riboswitch upstream of btuB and metE genes (not shown), except the species noted with the yellow asterisk. A list of species names can be found in Table S7.

